最近接触了决策树(Decision Tree, DT),将其应用于数据分析,任务目标是根据银行用户信息,应用DT和RF对银行用户是否购买银行储蓄产品进行预测。整理了处理过程记录在这篇博客里。第一版:2017.10.16下午。更新:2017.10.26.
1 数据来源
2 实验环境
3 数据预处理
4 算法实现
5 参考文献
1 数据来源
清理Chrome时删掉了下载链接,按照数据提供者的request,列出下面信息供使用者参考
This dataset is public available for research. The details are described in [Moro et al., 2011].
Please include this citation if you plan to use this database:
[Moro et al., 2011] S. Moro, R. Laureano and P. Cortez. Using Data Mining for Bank Direct Marketing: An Application of the CRISP-DM Methodology. In P. Novais et al. (Eds.), Proceedings of the European Simulation and Modelling Conference - ESM'2011, pp. 117-121, Guimarães, Portugal, October, 2011. EUROSIS.
Available at: [pdf] http://hdl.handle.net/1822/14838
[bib] http://www3.dsi.uminho.pt/pcortez/bib/2011-esm-1.txt
这组数据存储在两个.csv格式的文件中,分别是非完整版和完整版。16个features中,每个qualitative feature的缺失值都用unknown代替,quantitative feature没有缺失值。违约default label有yes和no。
2 实验环境
整个任务在Python的Spyder下实现,调用的外部modules有Pandas、matplotlib和sklearn。
3 数据预处理
打开数据存储的.csv文件,看到的数据是这样的:
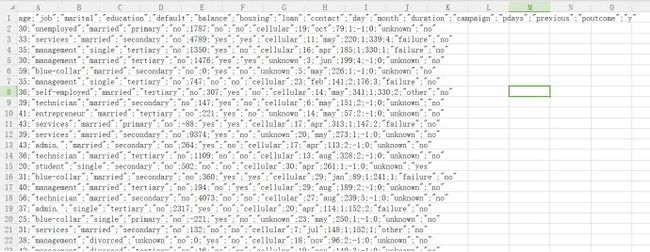
数据的第一行是feature names,之后每行存储一个用户信息,并保存在一个单元格中,不同的feature值以逗号','为间隔。为便于处理,对这些数据做分割,目的是使每一列表示一个feature。
代码如下:
import os
os.chdir('C:/WinPython-64bit-3.6.1.0Qt5/notebooks/DT/')
ori_file = open('bank-full.csv')
tmpdata = ori_file.readlines()
data0 = [''.join([term1 for term1 in term if term1 != '"']).split(';') for term in tmpdata]
data1 = [[int(term1) if term1[1:].isnumeric()==True or term1.isnumeric()==True else term1 \
for term1 in term] for term in data0]
data1 = [ [term1[:-1] if isinstance(term1,str) and term1.endswith('\n') else term1 \
for term1 in term] for term in data1]

代码中第14行将每一行的数据做分割,以逗号为标志,得到列表data0中的每个元素都是一个list,含17个元素,即用户的features。
如果将data0信息直接做处理,会注意到data0中凡是quantitative feature的数值都是以str格式保存,无法直接处理,如age信息如果是58岁,则调用时显示'58'而非58。于是用第15行代码将str的数字都转化成int。注意到这个表中的所有quantitative feature都是整数表示,所以用int(term)可以实现转化并且不引入误差。处理结果保存在data1中。
在后面用sklearn的决策树对数据做拟合的过程中出现了一个问题,即处理后的data1中,总有信息是以'\n'结尾的(换行),无法实现拟合。观察数据注意到data1每个元素的list中的最后一个元素,也就是用户的最后一个feature,从feature name到feature value都是以'\n'结束的。而数据的其他部分不含有'\n',因此加入第17行代码,删除以'\n'结尾的字符串的尾部。得到的data1完全不含'\n',可放心使用。
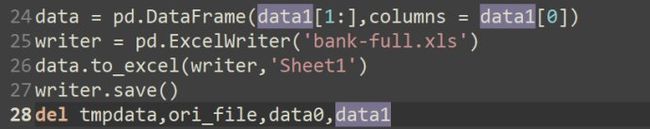
接下来将数据转化成我更容易处理的DataFrame格式,并保存到本地电脑:
data = pd.DataFrame(data1[1:],columns = data1[0])
writer = pd.ExcelWriter('bank-full.xls')
data.to_excel(writer,'Sheet1')
writer.save()
del tmpdata,ori_file,data0,data1
在算法实现中,我对原始数据做训练集和测试集的区分,比例为8:2,即80%为训练集其余为测试集。在选取过程中训练集从全部数据中随机选取,以保证每次运行过程中得到的训练集都不同。代码如下:
import random,time
training_ratio = 0.8
random.seed(time.time())
tmp_tt_index = list(range(data.shape[0]))
random.shuffle(tmp_tt_index)
training_index = sorted(tmp_tt_index[:int(tmp_tt_index.__len__()*training_ratio)])
test_index = sorted(tmp_tt_index[int(tmp_tt_index.__len__()*training_ratio):])
del tmp_tt_index

代码的第32行定义了随机数的seed,由运行时的当前时间决定。random.shuffle用于打乱index序列,training_index是经过排序的随机选出的用于训练的数据index。再按如下代码就可以实现训练集和测试集的生成:
features_selected = list(data.columns)
features_selected.remove('default')
data_training = pd.DataFrame(data.loc[training_index,features_selected],columns=features_selected)
data_test_ori = pd.DataFrame(data.loc[test_index,features_selected],columns=features_selected)
用于sklearn的决策树的数据,我目前不知道如何处理feature value不是数值的方法,所以需要把所有qualitative feature的值都转化成数字,这包括将是否违约的default数据的值'yes' & 'no'转化成数字。下面代码实现了这个功能,它看起来很笨:
label_vec_test_mat = label_vec_test.values
data_tra_mat = data_training.values
label_vec_tra_mat = label_vec_training.values
for i in range(len(label_vec_tra_mat)):
if label_vec_tra_mat[i] == 'yes':
label_vec_tra_mat[i] = 1
elif label_vec_tra_mat[i] == 'no' :
label_vec_tra_mat[i] = 0
for i in range(len(label_vec_test_mat)):
if label_vec_test_mat[i] == 'yes':
label_vec_test_mat[i] = 1
elif label_vec_test_mat[i] == 'no':
label_vec_test_mat[i] = 0
for i in range(data_tra_mat.shape[0]):
for j in range(data_tra_mat.shape[1]):
if data_tra_mat[i,j] == 'yes':
data_tra_mat[i,j] = 1
elif data_tra_mat[i,j] == 'no':
data_tra_mat[i,j] = 0
for i in range(data_test_mat.shape[0]):
for j in range(data_test_mat.shape[1]):
if data_test_mat[i,j] == 'yes':
data_test_mat[i,j] = 1
elif data_test_mat[i,j] == 'no':
data_test_mat[i,j] = 0
for i in range(data_tra_mat.shape[1]):
if isinstance(data_tra_mat[1,i],str):
list_space = list(set(data_tra_mat[:,i]))
list_space = sorted(list_space)
for j in range(data_tra_mat.shape[0]):
data_tra_mat[j,i] = list_space.index(data_tra_mat[j,i])
for k in range(data_test_mat.shape[0]):
data_test_mat[k,i] = list_space.index(data_test_mat[k,i])

转化过程的第45行代码,用于统计各qualitative feature中有多少unique value,再对属性赋值。
至此,数据预处理基本完成,但如果现在调用sklearn处理数据,还是会出现错误提示。需要加入下面代码:
from sklearn import preprocessing
lab_enc = preprocessing.LabelEncoder()
label_vec_tra_mat = lab_enc.fit_transform(label_vec_tra_mat)
这个代码的细节未知。
下面就可以把数据传给sklearn处理了。
4 算法实现
搞定了前面的数据预处理,只用下面几行就实现了CART分类:
from sklearn.tree import DecisionTreeClassifier
from sklearn.metrics import roc_curve
treefile = 'C:/WinPython-64bit-3.6.1.0Qt5/notebooks/DT/tree.pkl'
tree = DecisionTreeClassifier()
tree.fit(data_tra_mat,label_vec_tra_mat)
from sklearn.externals import joblib
joblib.dump(tree,treefile)
fpr,tpr,thresholds = roc_curve(label_vec_test_mat,tree.predict_proba(data_test_mat[:,:])[:,1],pos_label=1)
plt.plot(fpr,tpr,linewidth=2,label='ROC of CART')
plt.xlabel('False positive Rate')
plt.ylabel('True positive rate')
plt.ylim(0,1.05)
plt.xlim(0,1.05)
plt.legend(loc=4)
plt.show()
运行结果用ROC曲线评价分类的质量:
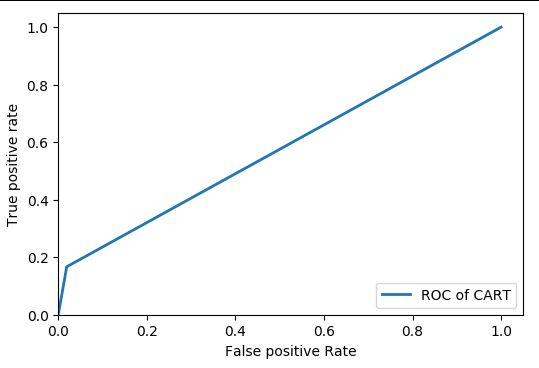
简单来说,这条ROC curve下面覆盖的面积越大,分类效果越好,最理想的点是true positive rate=1.0,false positive rate = 0.0的点。这里得到的曲线仅仅略微好于y = x即diagnoal 。分类效果不理想。
做到这里,我想到的可以进一步优化分类质量的工作有feature selection,另外就是也许仅仅使用DT并不能高质量分类数据,或许加入Random forest。这是两个可以改进的地方。
又或者是我哪里做错了吗?
2017.10.26更新:
在处理过程中重新阅读了数据提供者的论文,注意到提供者并非将数据用于预测是否违约,而是预测是否购买储蓄产品。对本文研究中的内容做相应修改,label从default改成y,也就是是否购买的label。其他数据都作为features/attributes.
在DT之后,进一步采用RF对数据做处理。预测结果达到了89%以上的正确率。但是考虑到label中绝大多数的class都是no,即不买储蓄产品,所以用正确率这个指标并不能充分描述预测性能。加入了precision/recall/f1这三个指标,precision=TP/(TP+FP), recall = TP/(TP+FN), f1 = 1/(1/precision + 1/recall),这三个指标的计算都需要用到confusion matrix。
预测结果precision > 70%, recall ~= 11%.
因数据已经经过一定程度的预处理,故在本研究中并不包含feature engineering。DT和RF本身的特点决定了不需要data scaling和centering。通过设置max depth和max nodes number可预防overfitting。
5 参考文献
[1] https://stackoverflow.com/questions/41925157/logisticregression-unknown-label-type-continuous-using-sklearn-in-python (这个回答解决了用sklearn指令调用数据显示错误的问题)
[2] Python数据分析和挖掘实战,机械工业出版社,张良均等,2016年
附:
数据feature信息
1. Title: Bank Marketing
2. Sources
Created by: Paulo Cortez (Univ. Minho) and Sérgio Moro (ISCTE-IUL) @ 2012
3. Past Usage:
The full dataset was described and analyzed in:
S. Moro, R. Laureano and P. Cortez. Using Data Mining for Bank Direct Marketing: An Application of the CRISP-DM Methodology.
In P. Novais et al. (Eds.), Proceedings of the European Simulation and Modelling Conference - ESM'2011, pp. 117-121, Guimarães,
Portugal, October, 2011. EUROSIS.
4. Relevant Information:
The data is related with direct marketing campaigns of a Portuguese banking institution.
The marketing campaigns were based on phone calls. Often, more than one contact to the same client was required,
in order to access if the product (bank term deposit) would be (or not) subscribed.
There are two datasets:
1) bank-full.csv with all examples, ordered by date (from May 2008 to November 2010).
2) bank.csv with 10% of the examples (4521), randomly selected from bank-full.csv.
The smallest dataset is provided to test more computationally demanding machine learning algorithms (e.g. SVM).
The classification goal is to predict if the client will subscribe a term deposit (variable y).
5. Number of Instances: 45211 for bank-full.csv (4521 for bank.csv)
6. Number of Attributes: 16 + output attribute.
7. Attribute information:
For more information, read [Moro et al., 2011].
Input variables:
# bank client data:
1 - age (numeric)
2 - job : type of job (categorical: "admin.","unknown","unemployed","management","housemaid","entrepreneur","student",
"blue-collar","self-employed","retired","technician","services")
3 - marital : marital status (categorical: "married","divorced","single"; note: "divorced" means divorced or widowed)
4 - education (categorical: "unknown","secondary","primary","tertiary")
5 - default: has credit in default? (binary: "yes","no")
6 - balance: average yearly balance, in euros (numeric)
7 - housing: has housing loan? (binary: "yes","no")
8 - loan: has personal loan? (binary: "yes","no")
# related with the last contact of the current campaign:
9 - contact: contact communication type (categorical: "unknown","telephone","cellular")
10 - day: last contact day of the month (numeric)
11 - month: last contact month of year (categorical: "jan", "feb", "mar", ..., "nov", "dec")
12 - duration: last contact duration, in seconds (numeric)
# other attributes:
13 - campaign: number of contacts performed during this campaign and for this client (numeric, includes last contact)
14 - pdays: number of days that passed by after the client was last contacted from a previous campaign (numeric, -1 means client was not previously contacted)
15 - previous: number of contacts performed before this campaign and for this client (numeric)
16 - poutcome: outcome of the previous marketing campaign (categorical: "unknown","other","failure","success")
Output variable (desired target):
17 - y - has the client subscribed a term deposit? (binary: "yes","no")
8. Missing Attribute Values: None