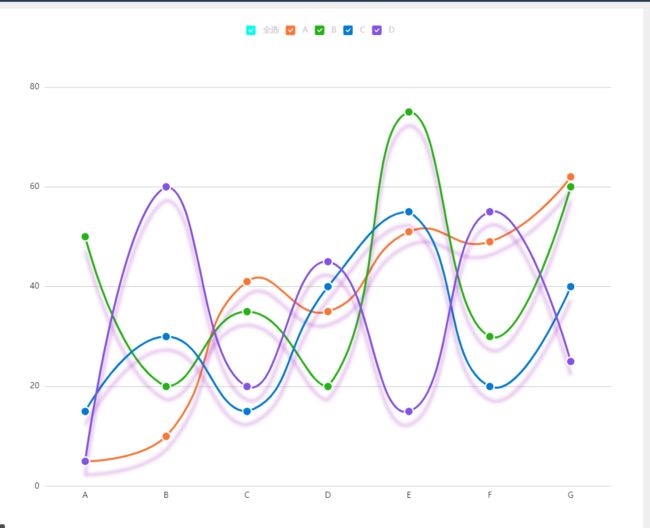
关键点:
-
legend>selected需要增加全选: true,用来展示和控制选中状态 -
series中需要给全选按钮造假数据,数据为空 - 注册
legendselectchanged事件,写全选逻辑
具体代码如下:
import echarts from "echarts";

let myChart = echarts.init(document.getElementById('自定义的id'), "light");

let option = {
    backgroundColor: "#fff",
    tooltip: {
        trigger: 'axis',
        show: true,
    },
    legend: {
        show: true,
        icon: 'path://M467.106909 581.073455l-107.636364-108.311273a55.645091 55.645091 0 1 0-78.94109 78.475636l148.154181 149.085091a55.458909 55.458909 0 0 0 40.680728 16.663273 55.389091 55.389091 0 0 0 39.982545-17.966546l278.039273-298.426181a55.645091 55.645091 0 1 0-81.454546-75.869091L467.130182 581.073455zM139.636364 0h744.727272a139.636364 139.636364 0 0 1 139.636364 139.636364v744.727272a139.636364 139.636364 0 0 1-139.636364 139.636364H139.636364a139.636364 139.636364 0 0 1-139.636364-139.636364V139.636364a139.636364 139.636364 0 0 1 139.636364-139.636364z',
        top: 20,
        align: 'left',
        textStyle: {
            fontSize: 12,
            color: '#c8c8c8'
        },
        selected: {
          全选: true,//全选按钮的展示
          A: true,
          B: true,
          C: true,
          D: true,
        },
    },
    grid: {
        left: '5%',
        right: '5%',
        top: '15%',
        bottom: '6%',
        containLabel: true
    },
    xAxis: {
        axisLine: {
            show: false
        },
        axisTick: {
            show: false
        },
        axisLabel: {
            interval: 0,
        },
        data: ['A', 'B', 'C', 'D', 'E', 'F', 'G']
    },
    yAxis: {
        axisLine: {
            show: false,
        },
        axisTick: {
            show: false
        },
    },
    series: [
      {//全选按钮的假数据
        name:'全选',
            type: 'line',
            smooth: true,
            symbol: 'circle',
            symbolSize: 13,
            lineStyle: {
                normal: {
                    width: 3,
                    shadowColor: 'rgba(155, 18, 184, .4)',
                    shadowBlur: 5,
                    shadowOffsetY: 20,
                    shadowOffsetX: 0,
                    color: '#fb7636',
                }
            },
            itemStyle: {
                color: '#00FFF0',
                borderColor: "#fff",
                borderWidth: 2,
            },

            data: []
        },{
        name:'A',
            type: 'line',
            smooth: true,
            symbol: 'circle',
            symbolSize: 13,
            lineStyle: {
                normal: {
                    width: 3,
                    shadowColor: 'rgba(155, 18, 184, .4)',
                    shadowBlur: 5,
                    shadowOffsetY: 20,
                    shadowOffsetX: 0,
                    color: '#fb7636',
                }
            },
            itemStyle: {
                color: '#fb7636',
                borderColor: "#fff",
                borderWidth: 2,
            },

            data: [5, 10, 41, 35, 51, 49, 62]
        },
        {
            name:'B',
            type: 'line',
            smooth: true,
            symbol: 'circle',
            symbolSize: 13,
            lineStyle: {
                normal: {
                    width: 3,
                    shadowColor: 'rgba(155, 18, 184, .4)',
                    shadowBlur: 5,
                    shadowOffsetY: 20,
                    shadowOffsetX: 0,
                    color: '#24b314',
                }
            },
            itemStyle: {
                color: '#24b314',
                borderColor: "#fff",
                borderWidth: 2,
            },

            data: [50, 20, 35, 20, 75, 30, 60]
        },
        {
            name:'C',
            type: 'line',
            smooth: true,
            symbol: 'circle',
            symbolSize: 13,
            lineStyle: {
                normal: {
                    width: 3,
                    shadowColor: 'rgba(155, 18, 184, .4)',
                    shadowBlur: 5,
                    shadowOffsetY: 20,
                    shadowOffsetX: 0,
                    color: '#027ad7',
                }
            },
            itemStyle: {
                color: '#027ad7',
                borderColor: "#fff",
                borderWidth: 2,
            },

            data: [15, 30, 15, 40, 55, 20, 40]
        },
        {
            name:'D',
            type: 'line',
            smooth: true,
            symbol: 'circle',
            symbolSize: 13,
            lineStyle: {
                normal: {
                    width: 3,
                    shadowColor: 'rgba(155, 18, 184, .4)',
                    shadowBlur: 5,
                    shadowOffsetY: 20,
                    shadowOffsetX: 0,
                    color: '#8452e7',
                }
            },
            itemStyle: {
                color: '#8452e7',
                borderColor: "#fff",
                borderWidth: 2,
            },

            data: [5, 60, 20, 45, 15, 55, 25]
        },
    ]
};

 myChart.setOption(option)
// 处理legend点击事件
  //增加全选功能
  myChart.on("legendselectchanged", e => {
    let name = e.name;
    let allSelect = "全选";
    if (name === allSelect) {
      //全选的点击事件
      for (let key in e.selected) {
        option.legend.selected[key] = e.selected[allSelect];
      }
    } else {
      //普通多选框的点击事件
      option.legend.selected[name] = e.selected[name];
      if (e.selected.name == false) {
        // 当前选中设置为false时
        option.legend.selected[allSelect] = false;
      } else {
        // 当前选中设置为true时
        let arr = Object.values(e.selected).splice(1);
        let flag = arr.every(currentValue => {
          return currentValue == true;
        });
        option.legend.selected[allSelect] = flag;
      }
    }
    myChart.setOption(option,);
  });
效果图:
