配置代码
export const YYSFL = function(data) {
  return {
    color: ['#1FD0A3', '#0FA7E9', '#FFC929', '#F2775A', '#EF5350'],
    tooltip: {
      trigger: 'item'
    },
    title: {
      show: true, //显示策略,默认值true,可选为:true(显示) | false(隐藏)
      text: '55%', //主标题文本,'\n'指定换行
      link: '', //主标题文本超链接,默认值true
      target: null, //指定窗口打开主标题超链接,支持'self' | 'blank',不指定等同为'blank'(新窗口)
      subtext: '地下饮用水', //副标题文本,'\n'指定换行
      sublink: '', //副标题文本超链接
      subtarget: null, //指定窗口打开副标题超链接,支持'self' | 'blank',不指定等同为'blank'(新窗口)
      x: 'center', //水平安放位置,默认为'left',可选为:'center' | 'left' | 'right' | {number}(x坐标,单位px)
      y: 'center', //垂直安放位置,默认为top,可选为:'top' | 'bottom' | 'center' | {number}(y坐标,单位px)
      textAlign: null, //水平对齐方式,默认根据x设置自动调整,可选为: left' | 'right' | 'center
      backgroundColor: 'rgba(0,0,0,0)', //标题背景颜色,默认'rgba(0,0,0,0)'透明
      borderColor: '#ccc', //标题边框颜色,默认'#ccc'
      borderWidth: 0, //标题边框线宽,单位px,默认为0(无边框)
      padding: 5, //标题内边距,单位px,默认各方向内边距为5,接受数组分别设定上右下左边距
      itemGap: 10, //主副标题纵向间隔,单位px,默认为10
      textStyle: {
        //主标题文本样式{"fontSize": 18,"fontWeight": "bolder","color": "#333"}
        // fontFamily: 'Arial, Verdana, sans...',
        fontSize: 30,
        fontStyle: 'normal',
        fontWeight: 'bold',
        color: '#4A4A4A'
      }
    },
    legend: {
      top: 55,
      // left: 'right',
      right: 10,
      icon: 'circle',
      itemWidth: 10,
      itemHeight: 7, //修改icon图形大小
      bottom: 0,
      align: 'left',
      orient: 'vertical',
      textStyle:{
        rich:(function(){
          const colors = ['#1FD0A3', '#0FA7E9', '#FFC929', '#F2775A', '#EF5350']
          return ["a","b","c","d","e"].reduce((temp,item,index)=>{
            temp[item]={
              color:colors[index]
            }
            return temp
          },{})
        })()
      },
      formatter: function(name) {
        const dt={
          'Ⅰ类':{
            value:+data[0].value,
            prefix:"a"
          },
          'Ⅱ类':{
            value:+data[1].value,
            prefix:"b"
          },
          'Ⅲ类':{
            value:+data[2].value,
            prefix:"c"
          },
          'Ⅳ类':{
            value:+data[3].value,
            prefix:"d"
          },
          'Ⅴ类':{
            value:+data[3].value,
            prefix:"e"
          },
        };
        return name+"{"+dt[name].prefix+"|    "+dt[name].value+"}"
      },

    },
    grid: {
      top: '20%',
      left: '1%',
      right: '15%',
      bottom: '5%',
      containLabel: true
    },
    series: [
      {
        name: 'xxx',
        type: 'pie',
        radius: ['60%', '80%'],
        avoidLabelOverlap: false,
        label: {
          show: false,
          position: 'outside',
          formatter: '{b}: {d}%',
          fontSize: 14
        },
        emphasis: {
          label: {
            show: false,
            fontSize: '40',
            fontWeight: 'bold'
          }
        },
        labelLine: {
          show: true
        },
        data: data
      }
    ]
  }
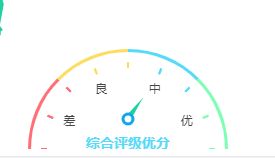
}import * as echarts from 'echarts'; export const ecologyStaticConfig = { grid:{ bottom:'15%' }, series: [{ type: 'gauge', startAngle: 180, endAngle: 0, min: 0, max: 1, splitNumber: 8, radius:'200%', center:['50%','100%'], axisLine: { lineStyle: { width: 3, color: [ [0.25, '#FF6E76'], [0.5, '#FDDD60'], [0.75, '#58D9F9'], [1, '#7CFFB2'] ] } }, pointer: { // icon: 'path://M12.8,0.7l12,40.1H0.7L12.8,0.7z', // width: 10, icon:"triangle", length: '20%', width: 5, offsetCenter: [-18, '-30%'], itemStyle: { borderWidth: 3, color:'#1FD0A3', // borderColor:"#0FA7E9" } }, anchor: { show: true, showAbove: true, size: 10, offsetCenter: [0, '-30%'], itemStyle: { borderWidth: 3, color:'#fff', borderColor:"#0FA7E9" } }, axisTick: { splitNumber:1, show:true, length: 6, lineStyle: { color: 'auto', width: 2 } }, splitLine: { show:false, length: 20, lineStyle: { color: 'auto', width: 5 } }, axisLabel: { show:true, color: '#464646', fontSize: 12, distance: 0, formatter: function (value) { if (value === 0.875) { return '优'; } else if (value === 0.625) { return '中'; } else if (value === 0.375) { return '良'; } else if (value === 0.125) { return '差'; } } }, title: { offsetCenter: [0, '20%'], fontSize: 14 }, detail: { fontSize: 14, offsetCenter: [0, '-5%'], valueAnimation: true, formatter: function (value) { let level = '优'; if(value<0.125){ level='差' }else if(value<0.375){ level='良' }else if(value<0.625){ level='中' }else { level = '优'; } return '综合评级' + level + '分'; }, color: 'auto' }, data: [{ value: 0.70, }] }] };- 区间柱状图
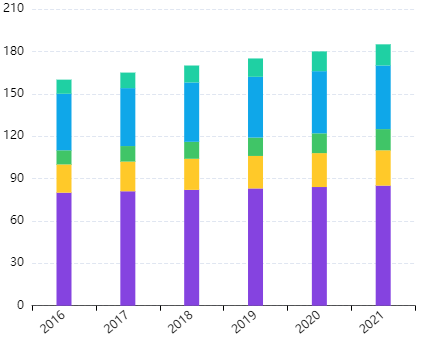
import * as echarts from 'echarts';
export const fileStaticConfig = {
    tooltip: {
        trigger: 'axis'
    },
    color:["#8543E0","#FFC929","#40C567","#0FA7E9","#1FD0A3"],
    legend: {
        data: ['林地', '建设', "草地", "农田", "未利用"],
        top:5,
        left: 'right',
        textStyle: { color: "#4A4A4A" },
        icon: "circle",
        itemWidth: 10,
        itemHeight: 7, //修改icon图形大小
        bottom: 0
    },
    title:{
        text: '',
        textStyle:{
            fontFamily:'Microsoft yahei', //字体
            fontSize:15, //大小
            color:'#000',
            opacity: 0.75,
        }
    },
    grid: {
        left: '2%',
        right: '6%',
        top: "20%",
        bottom: '0%',
        containLabel: true
    },
    xAxis: {
        type: 'category',
        boundaryGap: true,
        axisLine: {
            lineStyle: {
                color: '#000',
                width: 1,
                opacity: 0.65,
                // type: "dashed"                 //这里是坐标轴的宽度
            }
        },
        axisLabel: {
            interval:0,
            rotate:40
         },
        data: ['2016','2017','2018','2019','2020','2021']
    },
    yAxis: {
        type: 'value',
        name:'面积',
        axisLine: {
            lineStyle: {
                color: '#000',
                width: 1,
                opacity: 0.15,
                type: "dashed"                 //这里是坐标轴的宽度
            }
        },
        splitLine: {
            show: true,
            lineStyle:{
                type:'dashed'
            }
        }
    },
    series: [
        {
            name: '林地',
            type: 'bar',
            stack: 'one',
            barWidth: 15,
            data: [80, 81, 82, 83, 84, 85]
        },
        {
            name: '建设',
            type: 'bar',
            stack: 'one',
            barWidth: 15,
            data: [20, 21, 22, 23, 24, 25]
        },
        {
            name: '草地',
            type: 'bar',
            stack: 'one',
            barWidth: 15,
            data: [10, 11, 12, 13, 14, 15]
        },
        {
            name: '农田',
            type: 'bar',
            stack: 'one',
            barWidth: 15,
            data: [40, 41, 42, 43, 44, 45]
        },
        {
            name: '未利用',
            type: 'bar',
            stack: 'one',
            barWidth: 15,
            data: [10, 11, 12, 13, 14, 15]
        }
    ]
}
export const option = {
  tooltip: {
    trigger: 'axis'
  },
  color:["#0FA7E9"],
  title:{
      text: '',
      textStyle:{
          fontFamily:'Microsoft yahei', //字体
          fontSize:15, //大小
          color:'#000',
          opacity: 0.75,
      }
  },
  grid: {
      left: '2%',
      right: '6%',
      top: "10%",
      bottom: 60,
      containLabel: true
  },
  xAxis: {
    type: 'category',
    boundaryGap: true,
    axisLine: {
        lineStyle: {
            color: '#000',
            width: 1,
            opacity: 0.65,
            // type: "dashed"                 //这里是坐标轴的宽度
        }
    },
    axisLabel: {
        interval:0,
        rotate:40
      },
    data: ['1月', '2月', '3月', '4月', '5月', '6月', '7月', '8月', '9月', '10月', '11月', '12月']
  },
  yAxis: {
    type: 'value',
    name:'AQI',
    max:300,
    axisLine: {
      lineStyle: {
          color: '#000',
          width: 1,
          opacity: 0.15,
          type: "dashed"                 //这里是坐标轴的宽度
      }
    },
    splitLine: {
        show: true,
        lineStyle:{
            type:'dashed'
        }
    }
  },
  series: [
    {
      areaStyle: {
        opacity: 0.8
      },
      barWidth: 15,
      data: [100, 146, 146, 165, {
        value: 220,
      }, 200, 190, 150, 140, 130, 110, 100],
      type: 'bar',
      markPoint: {
        symbolSize: 0,
        label: {
          color: '#0FA7E9',
          fontWeight: 'bold',
          position: 'top'
        },
        data: [
            {type: 'max', name: '最大值'}
        ]
      }
    }
  ]
}export const SLMJ = {
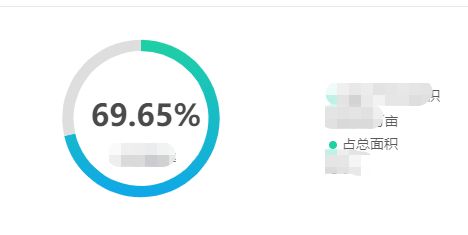
// color: ['#1FD0A3', '#dedede'],
tooltip: {
trigger: 'item'
},
title: {
show: true, //显示策略,默认值true,可选为:true(显示) | false(隐藏)
text: '69.65%', //主标题文本,'\n'指定换行
link: '', //主标题文本超链接,默认值true
target: null, //指定窗口打开主标题超链接,支持'self' | 'blank',不指定等同为'blank'(新窗口)
subtext: '森林覆盖率', //副标题文本,'\n'指定换行
sublink: '', //副标题文本超链接
subtarget: null, //指定窗口打开副标题超链接,支持'self' | 'blank',不指定等同为'blank'(新窗口)
x: '30%', //水平安放位置,默认为'left',可选为:'center' | 'left' | 'right' | {number}(x坐标,单位px)
y: 'center', //垂直安放位置,默认为top,可选为:'top' | 'bottom' | 'center' | {number}(y坐标,单位px)
textAlign: 'center', //水平对齐方式,默认根据x设置自动调整,可选为: left' | 'right' | 'center
backgroundColor: 'rgba(0,0,0,0)', //标题背景颜色,默认'rgba(0,0,0,0)'透明
borderColor: '#ccc', //标题边框颜色,默认'#ccc'
borderWidth: 0, //标题边框线宽,单位px,默认为0(无边框)
padding: 5, //标题内边距,单位px,默认各方向内边距为5,接受数组分别设定上右下左边距
itemGap: 10, //主副标题纵向间隔,单位px,默认为10
textStyle: {
//主标题文本样式{"fontSize": 18,"fontWeight": "bolder","color": "#333"}
// fontFamily: 'Arial, Verdana, sans...',
fontSize: 30,
fontStyle: 'normal',
fontWeight: 'bold',
color: '#4A4A4A'
}
},
legend: {
show: false,
top: 55,
// left: 'right',
right: 50,
icon: 'circle',
itemWidth: 10,
itemHeight: 7, //修改icon图形大小
bottom: 0,
align: 'left',
orient: 'vertical'
},
grid: {
top: '20%',
left: '1%',
right: '15%',
bottom: '5%',
containLabel: true
},
series: [
{
name: '森林面积',
type: 'pie',
radius: ['60%', '70%'],
center: ['30%', '50%'], // 外圆的位置
avoidLabelOverlap: false,
label: {
show: false,
position: 'outside',
formatter: '{b}: {d}%',
fontSize: 14
},
emphasis: {
label: {
show: false,
fontSize: '40',
fontWeight: 'bold'
}
},
data: [
{
value: 20,
name: '秦岭天然林面积',
itemStyle: {
color: {
type: 'linear',
x: 0,
y: 0,
x2: 0,
y2: 1,
colorStops: [
{
offset: 0,
color: '#1FD0A3' // 0% 处的颜色
},
{
offset: 1,
color: '#0FA7E9' // 100% 处的颜色
}
]
}
},
labelLine: {
show: true
}
},
{ value: 8, name: 'Ⅱ类', itemStyle: {
color: "#dedede"}}
]
}
]
}
- 区域折线图
配置:
import * as echarts from 'echarts'
//水质达标率
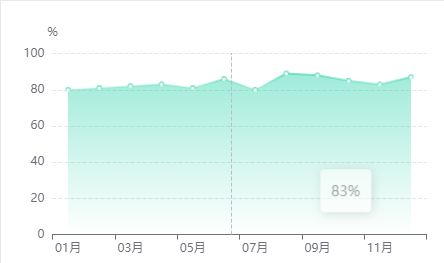
export const SZDBL = {
  tooltip: {
    trigger: 'axis',
    formatter:'{c}%'
  },
  color: ['#1FD0A3'],
  title: {
    text: '',
    x: 10,
    y: 0,
    textStyle: {
      fontFamily: 'Microsoft yahei', //字体
      fontSize: 15, //大小
      color: '#000',
      opacity: 0.75
    }
  },
  grid: {
    top: '20%',
    left: '5%',
    right: '5%',
    bottom: '5%',
    containLabel: true
  },
  xAxis: {
    type: 'category',
    boundaryGap: true,
    interval:0,
    data: ['1月', '2月', '3月', '4月', '5月', '6月', '7月', '8月', '9月', '10月', '11月', '12月']
  },
  yAxis: {
    type: 'value',
    name: '%',
    splitLine: {
      show: true,
      lineStyle: {
        type: 'dashed'
      }
    }
  },
  series: [
    {
      areaStyle: {
        opacity: 0.8
      },
      itemStyle: {
        normal: {
          color: new echarts.graphic.LinearGradient(0, 0, 0, 1, [
            { offset: 0, color: ' rgba(31, 208, 163, 0.61)' },
            { offset: 1, color: 'rgba(31, 208, 163, 0)' }
          ])
        }
      },
      data: [36, 46, 54, 63, 75, 84],
      type: 'line',
      areaStyle: {}
    }
  ]
}
{{item.name}}
{{time}}
{{item}}
{{item|filterStatus}}
{{item.name}}

