树莓派 opencv学习记录DAY-2-图像绘画
今天学习对图像的绘画操作
绘制直线、圆、矩形、椭圆、多边形、文字
| 图形 | 函数 |
| 直线 | cv.line(img,start,end,color,thickness) 图片对象,起始坐标(x轴,y轴),结束坐标,颜色,宽度 |
| 圆 | cv.circle(img,centerpoint, r, color, thickness) 图片对象,中心点坐标,半径大小,颜色,宽度 |
| 矩形 | cv.rectangle(img,leftupper,rightdown,color,thickness) 图片对象,左上角坐标,右下角坐标,颜色,宽度 |
| 椭圆 | cv.ellipse(img,centerpoint,axesLength,angle,stratAngle,endAngle,color,thickness) 图片对象,中心点坐标,长短轴,顺时针旋转度数,开始角度,颜色,宽度 |
| 文字 | cv.putText(img,text,station, font, fontsize,color,thickness,lineType) 图片对象,文字,坐标,字体,大小,颜色,宽度,线型 |
这里给出font的样式:
cv.FONT_HERSHEY_SIMPLEX
cv.FONT_HERSHEY_PLAIN
cv.FONT_HERSHEY_DUPLEX
cv.FONT_HERSHEY_COMPLEX
cv.FONT_HERSHEY_TRIPLEX
cv.FONT_HERSHEY_COMPLEX_SMALL
cv.FONT_HERSHEY_SCRIPT_SIMPLEX
cv.FONT_HERSHEY_SCRIPT_COMPLEX
cv.FONT_ITALIC
多边形绘画需要用到2个np函数
array创建各点坐标的数组
np.array([[10,5],[20,30],[70,20],[50,10]], np.int32)# array必须是int32型reshape变换数组排列格式,将数组设置成cv函数中通用格式
pts = pts.reshape((-1,1,2,))
#括号里的3给参数分别是行数、列数、维数,意思是以一列显示这个二维数组

这里举个简单的例子

np.arange(16).reshape(2,8) #生成16个自然数,以2行8列的形式显示
# Out:
# array([[ 0,  1,  2,  3,  4,  5,  6,  7],
#       [ 8,  9, 10, 11, 12, 13, 14, 15]])

参数为-1时,会自动计算
np.arange(16).reshape(2,-1) #生成16个自然数,以2行x列的形式显示
x = 16 / 2 = 8
一个cv函数
cv2.polylines将各点连线
cv2.polylines(img,array,isClosed=True/False, color, thickness)
#图片对象,点坐标,是否闭合,颜色,宽度
例程:
pts = np.array([[10, 10], [80, 10], [80, 100], [10, 100]], np.int32)
pts = pts.reshape((-1, 1, 2))
cv2.polylines(img, [pts], True, (255, 255, 0), 1)
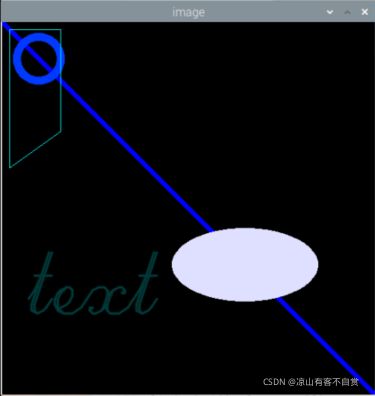
综合示例
import numpy as np
import cv2 as cv
import matplotlib.pyplot as plt

img = np.zeros((512,512,3),np.uint8)
#img = cv.imread('islands.jpg',0)
cv.line(img,(0,0),(511,511),(255,0,0),5)
cv.circle(img,(50,50), 30, (255,55,0), 10)
cv.putText(img,"text",(36,400),cv.FONT_HERSHEY_SCRIPT_COMPLEX,4,(55,55,0),2,cv.LINE_AA)
cv.ellipse(img,(333,333),(100,50),0,0,360,(255,222,222),-1)
pts = np.array([[10, 10], [80, 10], [80, 150], [10, 200]], np.int32)
pts = pts.reshape((-1, 1, 2))
cv.polylines(img, [pts], True, (255, 255, 0), 1)

cv.imshow('image',img)
cv.waitKey(0)
plt.imshow(img[:,:,::-1])

plt.show()
效果展示:
