多项式回归详解 从零开始 从理论到实践
多项式回归详解 从零开始 从理论到实践
- 一、多项式回归的理解
-
- 1.1、字面含义
- 1.2、引申
-
- 1.2.1、多项式回归
- 二、sklearn的使用
-
- 2.1、方法与属性
- 2.2、实例应用
-
- 2.2.1、拟合非线性关系
- 2.2.2、处理特征之间的影响
- 2.2.3、多项式回归与不同degree的对比
一、多项式回归的理解
上一章是对线性关系的建模。比如在线性回归中,会假设建筑物的楼层数和建筑物的高度是一个线性关系,20层楼是10层楼的两倍左右高,10层楼是5层楼的两倍左右高。(即便不是线性关系,但是近似线性关系,误差很小,即可以等同线性关系)
然而在现实生活中,许多关系则几乎完全不是线性的,比如学生学习的时间和考试分数之间的关系,在60分及格分以上,考试每提高10分,所花的时间会越多(因为后面基本都是越来越难的题目,需要花更多时间练习,而不是每道题目难度一样)。
多项式回归是线性回归的一种扩展,它可以使我们对非线性关系进行建模。线性回归使用直线来拟合数据,如一次函数 y = k x + b y=kx+b y=kx+b等。而多项式回归则使用曲线来拟合数据,如二次函数 y = a x 2 + b x + c y=ax^2+bx+c y=ax2+bx+c、三次函数 y = a x 3 + b x 2 + c x + d y=ax^3+bx^2+cx+d y=ax3+bx2+cx+d以及多次函数等来拟合数据。
通过线性回归所不能解决的问题出发,由此来介绍多项式回归。
参考1 一次函数与直线的关系
参考2 线性函数 非线性函数 多项式函数
1.1、字面含义
多项式的理解:
“多项式回归”由“多项式”和“回归”组成。
“多项式”(polynomial)的含义:在数学中,多项式是指由若干个单项式(monomial)相加组成的代数式叫做多项式(若有减法:减一个数等于加上它的相反数)。
多项式中的每个单项式叫做多项式的项,这些单项式中的最高项次数,就是这个多项式的次数。单项式由单个或多个变量(一般为单个 x x x)和系数相乘组成,或者不含变量,即不含字母的单个系数(常数)组成,这个不含字母的项叫做常数项。
多项式函数:
形如 f ( x ) = a n x n + a n − 1 x ( n − 1 ) + … + a 2 x 2 + a 1 x + a 0 f(x)=a_nx^n+a_{n-1}x^{(n-1)}+…+a_2x^2+a_1x+a_0 f(x)=anxn+an−1x(n−1)+…+a2x2+a1x+a0的函数,叫做多项式函数,它是由常数与自变量x经过有限次乘法与加法运算得到的。显然,当n=1时,其为一次函数 y = k x + b y=kx+b y=kx+b,当n=2时,其为二次函数。
参考3 多项式
参考4 整式
参考5 多项式函数
1.2、引申
1.2.1、多项式回归
有时直线难以拟合全部的数据,需要曲线来适应数据,如二次模型、三次模型等等。

一般情况下,数据的回归函数是未知的,即使已知也难以用一个简单的函数变换转化为线性模型,所以常用的做法是多项式回归(Polynomial Regression),即使用多项式函数拟合数据。
次数的选择:
多项式函数有多种,一般来说,需要先观察数据的形状,再去决定选用什么形式的多项式函数来处理问题。比如,从数据的散点图观察,如果有一个“弯”,就可以考虑用二次多项式;有两个“弯”,可以考虑用三次多项式;有三个“弯”,则考虑用四次多项式,以此类推。
当然,如果预先知道数据的属性,则有多少个
虽然真实的回归函数不一定是某个次数的多项式,但只要拟合的好,用适当的多项式来近似模拟真实的回归函数是可行的。
多元线性回归比较复杂,如二元二次的线性回归函数,仅二元就很复杂了。
y = β 0 + β 1 x 1 + β 2 x 2 + β 3 x 1 x 2 + β 4 x 1 2 + β 5 x 2 2 y=\beta_0+\beta_1x_1+\beta_2x_2+\beta_3x_1x_2+\beta_4x_1^2+\beta_5x_2^2 y=β0+β1x1+β2x2+β3x1x2+β4x12+β5x22
所以主要通过一元多项式回归模型来理解回归算法,它的结构如下:
y = β 0 + β 1 x + . . . + β n x n + ϵ y=\beta_0+\beta_1x+...+\beta_nx^n+\epsilon y=β0+β1x+...+βnxn+ϵ
同样,假设有 p p p 个样本,它的矩阵形式为:
y = X β + ϵ y=X\beta+\epsilon y=Xβ+ϵ
其中: y = [ y 1 y 2 ⋮ y p ] y=\begin{bmatrix} y_1&\\ y_2&\\ {\vdots}&\\ y_p&\\ \end{bmatrix} y=⎣⎢⎢⎢⎡y1y2⋮yp⎦⎥⎥⎥⎤, X = [ 1 x 1 x 1 2 ⋯ x 1 n 1 x 2 x 2 2 ⋯ x 2 n ⋮ ⋮ ⋮ ⋱ ⋮ 1 x p x p 2 ⋯ x p n ] X=\begin{bmatrix} 1&{x_{1}}&{x_{1}^2}&{\cdots}&{x_{1}^n}\\ 1&{x_{2}}&{x_{2}^2}&{\cdots}&{x_{2}^n}\\ {\vdots}&{\vdots}&{\vdots}&{\ddots}&{\vdots}\\ 1&{x_{p}}&{x_{p}^2}&{\cdots}&{x_{p}^n}\\ \end{bmatrix} X=⎣⎢⎢⎢⎡11⋮1x1x2⋮xpx12x22⋮xp2⋯⋯⋱⋯x1nx2n⋮xpn⎦⎥⎥⎥⎤, β = [ β 0 β 1 β 2 ⋮ β n ] \beta=\begin{bmatrix} \beta_0&\\ \beta_1&\\ \beta_2&\\ {\vdots}&\\ \beta_n&\\ \end{bmatrix} β=⎣⎢⎢⎢⎢⎢⎡β0β1β2⋮βn⎦⎥⎥⎥⎥⎥⎤, ϵ = [ ϵ 0 ϵ 1 ϵ 2 ⋮ ϵ p ] \epsilon=\begin{bmatrix} \epsilon_0&\\ \epsilon_1&\\ \epsilon_2&\\ {\vdots}&\\ \epsilon_p&\\ \end{bmatrix} ϵ=⎣⎢⎢⎢⎢⎢⎡ϵ0ϵ1ϵ2⋮ϵp⎦⎥⎥⎥⎥⎥⎤
令 x 1 = x x_1=x x1=x, x 2 = x 2 x_2=x^2 x2=x2, x 3 = x 3 x_3=x^3 x3=x3, x 4 = x 4 x_4=x^4 x4=x4
原方程改写为 y = β 0 + β 1 x 1 + β 2 x 2 + β 3 x 3 + β 4 x 4 + β 5 x 5 y=\beta_0+\beta_1x_1+\beta_2x_2+\beta_3x_3+\beta_4x_4+\beta_5x_5 y=β0+β1x1+β2x2+β3x3+β4x4+β5x5
于是有关线性回归的方法都可以使用了,也就是说,线性回归并不“知道” x 2 x^2 x2是 x x x的二次变换,而是把它当做两一个变量来处理,只是为模型添加了特征而没有改变线性回归拟合模型的方式。
由一元多项式回归模型的公式可以知道,只有一个自变量 x x x,但是 x x x 的级数(Degree) 不同。
二、sklearn的使用
多项式没有直接生成模型的方法,而是数据预处理效果,即:数据预处理(多项式特征)+线性模型。
该方法在sklearn包中的preprocessing模块中
class sklearn.preprocessing.PolynomialFeatures(degree=2, *, interaction_only=False, include_bias=True, order='C')
2.1、方法与属性
模型类函数的参数:
| 参数 | 取值 | 说明 |
|---|---|---|
| degree | int, default=2 | 多项式特征的次数 |
| interaction_only | bool, default=False | 如果为True,只生成交互特征,即不存在自己和自己相结合的特征项,如degree=2的2个特征属性 a a a和 b b b的数据进行多项式化,则没有 a 2 a^2 a2和 b 2 b^2 b2这两个属性,只有 [ 1 , a , b , a b ] [1, a, b, ab] [1,a,b,ab]这四个属性 |
| include_bias | bool, default=True | 表示有无 β 0 \beta_0 β0项。如果为True,则包含一列为1的偏差项,该列特征在多项式中的幂为0,在模型中充当截距。如interaction_only参数中的[1, a, b, ab]中的1,为False,则只有[a, b, ab]。 |
| order | {‘C’, ‘F’}, default=‘C’ | 在密集情况下,对输出数组进行控制的指令。'F’指令对于计算而更快,但是会减慢后续的拟合速度 |
作用(两个):
1 生成多项式
2 生成交互特征。
结果:
生成一个含有新特征的矩阵,该矩阵由指定的少于或者等于degree的特征次数的多项式组合而组成。
例如:
输入为2个特征 [ a , b ] [a, b] [a,b]
生成二次多项式特征,输出为6个特征 [ 1 , a , b , a 2 , a b , b 2 ] [1, a, b, a^2, ab, b^2] [1,a,b,a2,ab,b2]
本质:
不是像线性模型那样,直接构建多项式模型,而是数据预处理效果,即在生成模型前,提前将数据特征转变为多项式特征,所以达到即便是线性模型,还可以生成曲线。
模型类的属性:
| 参数 | 输出值 | 说明 |
|---|---|---|
| PolynomialFeature.powers_ | n维数组,形状(i, j) | 幂运算数组,根据degree的值而确定行,根据属性个数而确定列。degree=2、3分别对应6行和10行,2、3个属性就对应2列、3列,该矩阵与属性值数组进行计算而得出多项式结果 |
| PolynomialFeature.n_input_features_ | int, =j | 输入特征的总数,即属性个数,代表幂运算矩阵的列 |
| PolynomialFeature.n_output_features_ | int, =i | 输出特征的总数,即多项式化后,属性的个数,代表幂运算矩阵的行 |
举例理解:
from sklearn.preprocessing import PolynomialFeatures
import numpy as np
x = np.arange(6).reshape(3, 2)
x
"""
array([[0, 1],
       [2, 3],
       [4, 5]])
"""
# 数据预处理,将有两列的数组,即有两个特征属性的数组进行多项式化,degree=2,多项式变成6个项
plot = PolynomialFeatures(degree=2)
# 查看该类的幂运算数组
plot.powers_
"""
array([[0, 0],
       [1, 0],
       [0, 1],
       [2, 0],
       [1, 1],
       [0, 2]], dtype=int64)
"""
对于上面的幂运算数组:
[ 0 , 0 ] [0, 0] [0,0] 表示 a 0 × b 0 = 1 a^0\times b^0=1 a0×b0=1
[ 1 , 0 ] [1, 0] [1,0] 表示 a 1 × b 0 = a a^1\times b^0=a a1×b0=a
[ 0 , 1 ] [0, 1] [0,1] 表示 a 0 × b 1 = b a^0\times b^1=b a0×b1=b
[ 2 , 0 ] [2, 0] [2,0] 表示 a 2 × b 0 = a 2 a^2\times b^0=a^2 a2×b0=a2
[ 1 , 1 ] [1, 1] [1,1] 表示 a 1 × b 1 = a b a^1\times b^1=ab a1×b1=ab
[ 0 , 2 ] [0, 2] [0,2] 表示 a 0 × b 2 = b 2 a^0\times b^2=b^2 a0×b2=b2
# 类属性,查看输入特征与输出特征
plot.n_input_features_
"""
2
"""

plot.n_output_features_
"""
6
"""
# 幂运算矩阵与x进行运算,生成(i, j)即(6, 2)的数组
x_plot = plot.fit_transform(x)
x_plot
"""
array([[ 1.,  0.,  1.,  0.,  0.,  1.],
       [ 1.,  2.,  3.,  4.,  6.,  9.],
       [ 1.,  4.,  5., 16., 20., 25.]])
"""
按照幂运算数组的计算规则, x x x 的每一行代表 [ a , b ] [a, b] [a,b] 进行计算:
# x
array([[0, 1],
       [2, 3],
       [4, 5]])

# 幂运算数组
array([[0, 0],
       [1, 0],
       [0, 1],
       [2, 0],
       [1, 1],
       [0, 2]], dtype=int64)
对于第一行 [ 0 , 1 ] [0, 1] [0,1],即:
[ 0 0 × 1 0 , 0 1 × 1 0 , 0 0 × 1 1 , 0 2 × 1 0 , 0 1 + 1 1 , 0 0 + 1 2 ] = [ 1 , 0 , 1 , 0 , 0 , 1 ] [0^0\times1^0, 0^1\times1^0, 0^0\times1^1, 0^2\times1^0, 0^1+1^1, 0^0+1^2 ]=[1, 0, 1, 0, 0, 1] [00×10,01×10,00×11,02×10,01+11,00+12]=[1,0,1,0,0,1]
后面的也类似这样计算。
2.2、实例应用
2.2.1、拟合非线性关系
非线性关系拟合过程的理解
将特征提升到某个幂次(二次方,三次方等)来创建新特征。模型添加的新特征越多,拟合的“线”就越灵活。
以波士顿数据第一个属性为例:
from sklearn.linear_model import LinearRegression
from sklearn.datasets import load_boston
from sklearn.preprocessing import PolynomialFeatures
# 加载数据集,并只选取 1 个特征
boston =load_boston()
features = boston.data[:, 0:1]
target = boston.target
# 创建多项式特征
polynomial = PolynomialFeatures(degree=3, include_bias=False)
features_polynomial = polynomial.fit_transform(features)
# 创建线性回归对象与实例
linear = LinearRegression()
model = linear.fit(features_polynomial, target)
观察第一个样本,手动创建多项式特征
# 由于参数设置degree=3,所以最高维3阶
# 一阶不变
features[0]
"array([0.00632])"

# 升到二阶
features[0]**2
"array([3.99424e-05])"

# 升到三阶
features[0]**3
"array([2.52435968e-07])"
观察PolynomialFeatures函数产生的多项式特征
features_polynomial[0]
"array([6.32000000e-03, 3.99424000e-05, 2.52435968e-07])"
结果一样,三个特征 x x x、 x 2 x^2 x2、 x 3 x^3 x3 都包含在特征矩阵中,然后进行线性回归,就构造出了一个多项式回归模型
2.2.2、处理特征之间的影响
有时,对某个特征变量的影响会取决于另一个特征。比如现实生活中冲咖啡的例子,有一组二元特征:是否加糖(sugar)和是否搅拌(stirred)。要预测某咖啡是否是甜的。如果只把糖加入咖啡(sugar=1, stirred=0)不会使咖啡变甜,所有糖沉在咖啡底部,只搅拌咖啡而不加糖(sugar=0, stirred=1)也不会让它变甜。加糖和搅拌对咖啡变甜的影响是相互依赖的。
利用这种交互特征进行建模,可得到二元二次多项式函数,不过剔除了二次项:
y ^ = β ^ 0 + β ^ 1 x 1 + β ^ 2 x 2 + β ^ 3 x 1 x 2 + ϵ \hat y=\hat\beta_0+\hat\beta_1x_1+\hat\beta_2x_2+\hat\beta_3x_1x_2+\epsilon y^=β^0+β^1x1+β^2x2+β^3x1x2+ϵ
其中, x 1 x_1 x1和 x 2 x_2 x2分别是sugar和stirred的值, x 1 x 2 x_1x_2 x1x2代表两者之间的相互作用。
在类方法中的参数interaction_only,调整为True就表示生成交互特征。
以波士顿房价的前两个属性为实例:
from sklearn.linear_model import LinearRegression
from sklearn.datasets import load_boston
from sklearn.preprocessing import PolynomialFeatures
# 加载数据集,并只选取 2 个特征
boston =load_boston()
features = boston.data[:, 0:2]
target = boston.target
# 创建交互特征
interaction = PolynomialFeatures(degree=3, include_bias=False, interaction_only=True)
features_interaction = interaction.fit_transform(features)
# 创建线性回归对象与实例
linear = LinearRegression()
model = linear.fit(features_interaction, target)
interaction.powers_
"""
array([[1, 0],
       [0, 1],
       [1, 1]], dtype=int64)
"""
第一个样本的交互特征
features_interaction[0]
"""
array([6.3200e-03, 1.8000e+01, 1.1376e-01])
"""
手动计算交互特征
features[0]
"""
array([6.32e-03, 1.80e+01])
"""
import numpy as np
interaction_term = np.multiply(features[0, 0], features[0, 1])
np.array([interaction_term])
"""
array([0.11376])
"""
np.concatenate((features[0], np.array([interaction_term])))
"""
array([6.3200e-03, 1.8000e+01, 1.1376e-01])
"""
结果相等
2.2.3、多项式回归与不同degree的对比
import numpy as np
import matplotlib.pyplot as plt
from sklearn.preprocessing import PolynomialFeatures
from sklearn.linear_model import LinearRegression
# 创建训练集和测试集
def f(x):
    return x * np.sin(x)
x_plot = np.linspace(0, 10, 100)

x = np.linspace(0, 10, 100)
rng = np.random.RandomState(3)
rng.shuffle(x)
x = np.sort(x[:30])
y = f(x)
# 创建训练集X(30)和测试集X_plot(100)
X = x[:, np.newaxis]
X_plot = x_plot[:, np.newaxis]
# 设置不同degree的颜色和线的样式
colors = ['m', 'r', 'g']
linestyles = ['-', '--', ':']
fig = plt.figure(figsize=(15, 6))
plt.plot(x_plot, f(x_plot), color='blue', linewidth=1, label='ground truth')
plt.scatter(x, y, color='navy', s=10, marker='o', label='training points')


for count, degree in enumerate([3, 4, 5]):
    polynomial = PolynomialFeatures(degree=degree, include_bias=False)
    train_polynomial = polynomial.fit_transform(X)
    test_polynomial = polynomial.fit_transform(X_plot)

    linear = LinearRegression()
    model = linear.fit(train_polynomial, y)
    y_plot = model.predict(test_polynomial)
    plt.plot(x_plot, y_plot, color=colors[count], linewidth=1, linestyle='-', label="degree %d" % degree)
    #plt.plot(1,2, linestyle='--')
    plt.legend(loc='lower left')
plt.show()
结果展示:

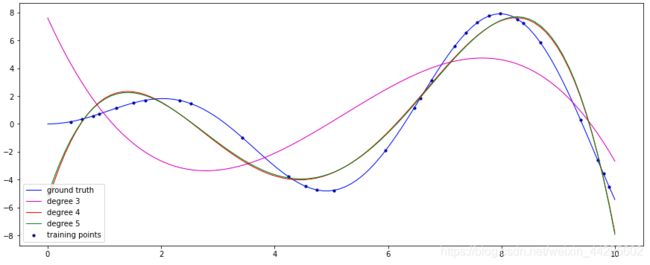
从图像可以看出,degree=3,图像有两个“弯”;degree=4,图像有3个“弯”,接近标准曲线;而degree=4时,图像也只有3个“弯”(已经是标答),且相对于degree=4的曲线偏上一点,也就是更接近标准曲线。
可见阶数越高,曲线的弯曲形状越大,越接近函数曲线。