手把手教你使用ggplot2绘制条形图
数据分析报告中经常会看见各种各样的条形图,如简单条形图、水平交错条形图、堆叠条形图、堆叠百分比条形图等,本文从R语言的角度,教大家绘制各式各样的条形图。
绘制离散单变量的条形图
从数据形式来看:有汇总好的数据集和明细数据集
使用汇总好的数据集绘制条形图:
x <- c('A','B','C','D','E')
y <- c(13,22,16,31,8)
df <- data.frame(x = x, y = y)
ggplot(data = df, mapping = aes(x = x, y = y)) + geom_bar(stat = 'identity')
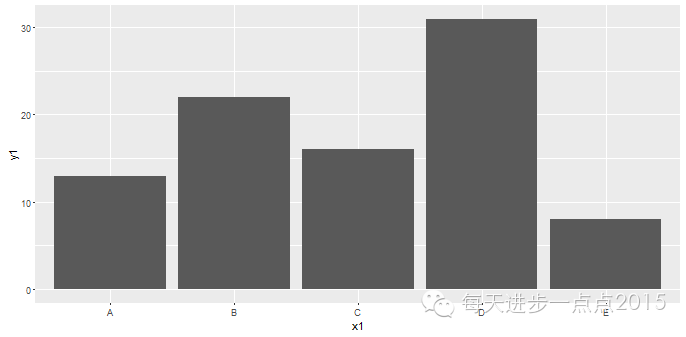
对于条形图的y轴就是数据框中原本的数值时,必须将geom_bar()函数中stat(统计转换)参数设置为'identity',即对原始数据集不作任何统计变换,而该参数的默认值为'count',即观测数量。
使用明细数据集绘制条形图:
set.seed(1234)
x <- sample(c('A','B','C','D'), size = 1000, replace = TRUE, prob = c(0.2,0.3,0.3,0.2))
y <- rnorm(1000) * 1000
df = data.frame(x = x, y = y)
ggplot(data = df, mapping = aes(x = x)) + geom_bar(stat = 'count')
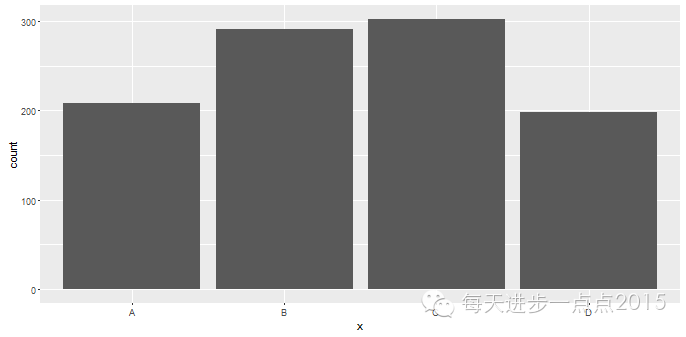
数据集本身是明细数据,而对于统计某个离散变量出现的频次时,geom_bar()函数中stat(统计转换)参数只能设置为默认,即'count'。
当然,如果需要对明细数据中的某个离散变量进行聚合(均值、求和、最大、最小、方差等)后再绘制条形图的话,建议先使用dplyr包中的group_by()函数和summarize()函数实现数据汇总,具体可参见:
强大的dplyr包实现数据预处理
从x轴的数据类型来看:有字符型的x值也有数值型的x值
上面的两幅图对应的x轴均为离散的字符型值,如果x值是数值型时,该如何正确绘制条形图?
set.seed(1234)
x <- sample(c(1,2,4,6,7), size = 1000, replace = TRUE, prob = c(0.1,0.2,0.2,0.3,0.2))
ggplot(data = data.frame(x = x), mapping = aes(x = x, y = ..count..)) + geom_bar(stat = 'count')
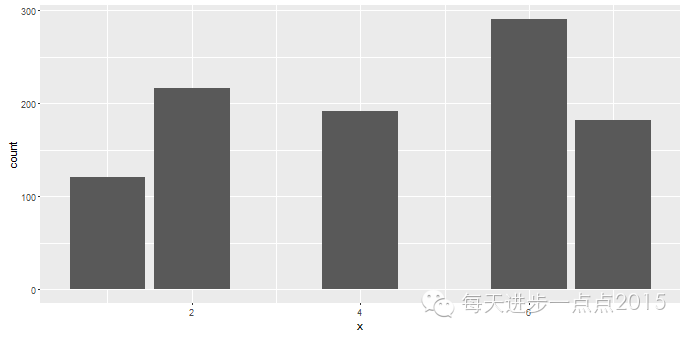
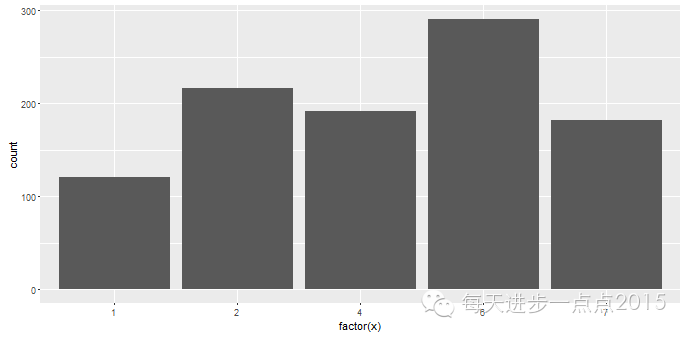
如果直接使用数值型变量作为条形图的x轴,我们会发现条形图之间产生空缺,这个空缺其实对应的是3和5两个值,这样的图形并不美观。为了能够使条形图之间不存在类似的空缺,需要将数值型的x转换为因子,即factor(x),如下图所示:
ggplot(data = data.frame(x = x3), mapping = aes(x = factor(x), y = ..count..)) + geom_bar(stat = 'count')
上面几幅图的颜色均为灰色的,显得并不是那么亮眼,为了使颜色更加丰富多彩,可以在geom_bar()函数内通过fill参数可colour参数设置条形图的填充色和边框色,例如:
ggplot(data = data.frame(x = x), mapping = aes(x = factor(x), y = ..count..)) + geom_bar(stat = 'count', fill = 'steelblue', colour = 'darkred')
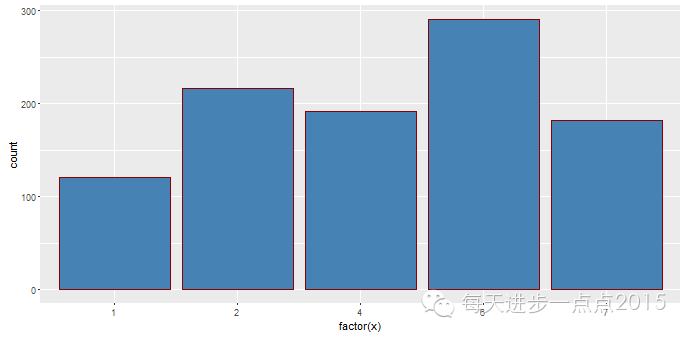
关于颜色的选择可以在R控制台中输入colours(),将返回657种颜色的字符。如果想查看所有含红色的颜色值,可以输入colours()[grep('red', colours())]返回27种红色。
绘制簇条形图
以上绘制的条形图均是基于一个离散变量作为x轴,如果想绘制两个离散变量的条形图即簇条形图该如何处理呢?具体见下方例子:
x <- rep(1:5, each = 3)
y <- rep(c('A','B','C'),times = 5)
set.seed(1234)
z <- round(runif(min = 10, max = 20, n = 15))
df <- data.frame(x = x, y = y, z = z)
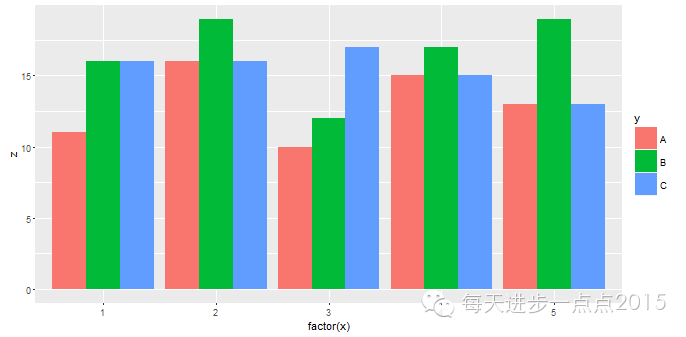
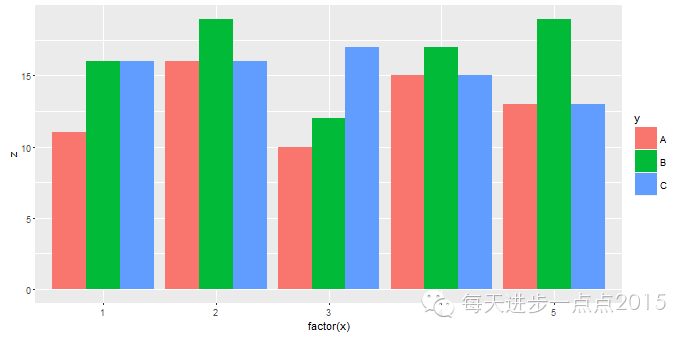
ggplot(data = df, mapping = aes(x = factor(x), y = z, fill = y)) + geom_bar(stat = 'identity', position = 'dodge')
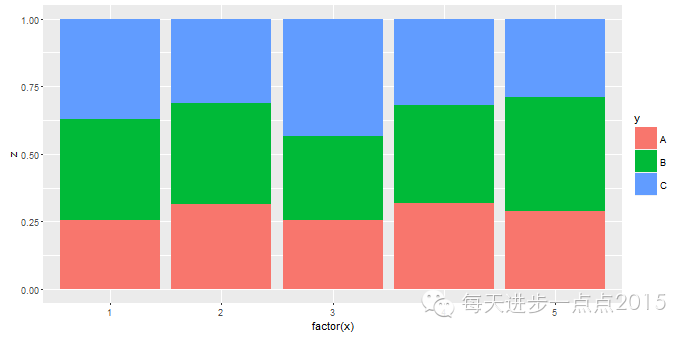
对于簇条形图只需在ggplot()函数的aes()参数中将其他离散变量赋给fill参数即可。这里的position参数表示条形图的摆放形式,默认为堆叠式(stack),还可以是百分比的堆叠式。下面分别设置这两种参数,查看一下条形图的摆放形式。
堆叠式:
ggplot(data = df, mapping = aes(x = factor(x), y = z, fill = y)) + geom_bar(stat = 'identity', position = 'stack')
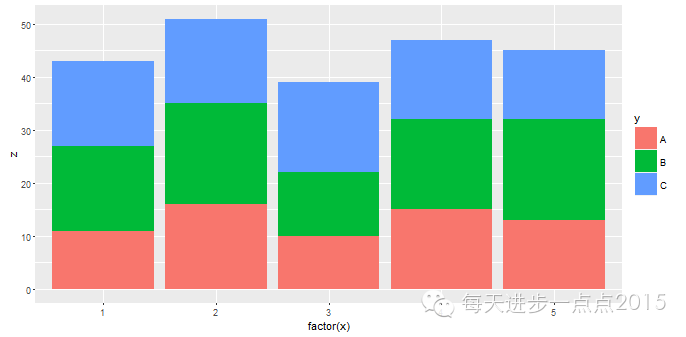
发现一个问题,条形图的堆叠顺序与图例顺序恰好相反,这个问题该如何处理呢?很简单,只需再添加guides()函数进行设置即可,如下所示:
ggplot(data = df, mapping = aes(x = factor(x), y = z, fill = y)) + geom_bar(stat = 'identity', position = 'stack') + guides(fill = guide_legend(reverse = TRUE))

guides()函数将图例引到fill属性中,再使图例反转即可。
百分比堆叠式:
ggplot(data = df, mapping = aes(x = factor(x), y = z, fill = y)) + geom_bar(stat = 'identity', position = 'fill')
颜色配置:
同样,如果觉得R自动配置的填充色不好看,还可以根据自定义的形式更改条形图的填充色,具体使用scale_fill_brewer()和scale_fill_manual()函数进行颜色设置。
scale_fill_brewer()函数使用R自带的ColorBrewer画板
ggplot(data = df, mapping = aes(x = factor(x), y = z, fill = y)) + geom_bar(stat = 'identity', position = 'dodge') + scale_fill_brewer(palette = 'Accent')
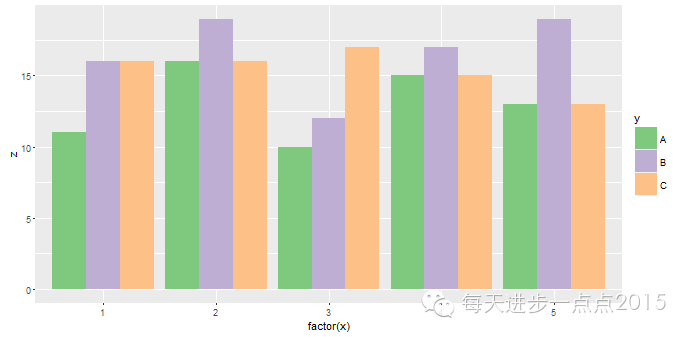
具体的调色板颜色可以查看scale_fill_brewer()函数的帮助。
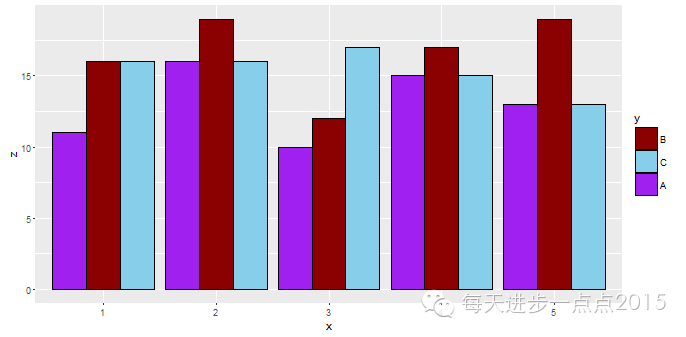
scale_fill_manual()函数允许用户给指定的分类水平设置响应的色彩,个人觉得这个比较方便
col <- c('darkred','skyblue','purple')
ggplot(data = df, mapping = aes(x = factor(x), y = z, fill = y)) + geom_bar(stat = 'identity', colour = 'black', position = 'dodge') + scale_fill_manual(values = col, limits = c('B','C','A')) + xlab('x')
该如何绘制有序的条形图?
#不经排序的条形图,默认按x值的顺序产生条形图
x <- c('A','B','C','D','E','F','G')
y <- c('xx','yy','yy','xx','xx','xx','yy')
z <- c(10,33,12,9,16,23,11)
df <- data.frame(x = x, y = y, z = z)
ggplot(data = df, mapping = aes(x = x, y = z, fill = y)) + geom_bar(stat = 'identity')
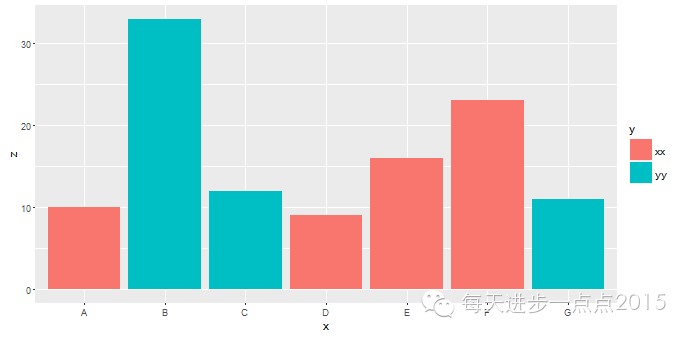
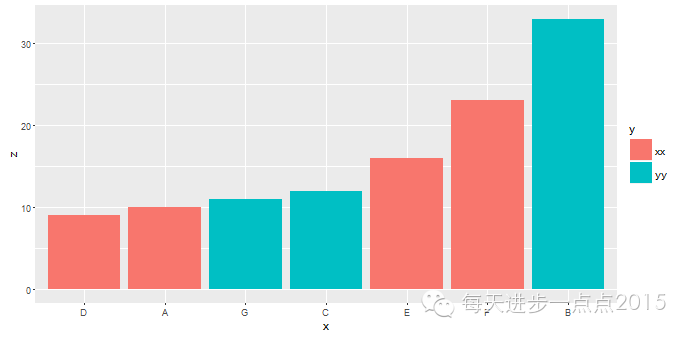
按z值的大小,重新排列条形图的顺序,只需将aes()中x的属性用reorder()函数更改即可。
ggplot(data = df, mapping = aes(x = reorder(x, z), y = z, fill = y)) + geom_bar(stat = 'identity') + xlab('x')
关于条形图的微调
如何y轴的正负值区分开来,并去除图例
set.seed(1234)
x = 1980 + 1:35
y = round(100*rnorm(35))
df = data.frame(x = x, y = y)
#判断y是否为正值
df <- transform(df, judge = ifelse(y>0, 'Yes', 'No'))
ggplot(data = df, mapping = aes(x = x, y = y, fill = judge)) + geom_bar(stat = 'identity', position = 'identity') + scale_fill_manual(values = c('blue','red'), guide = FALSE) + xlab('Year')
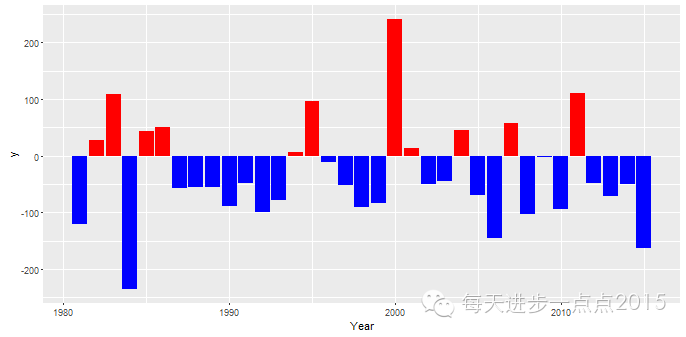
stat参数和position参数均设置为identity,目的是图形绘制不要求对原始数据做任何的变换,包括统计变换和图形变换,排除图例可以通过scale_fill_manual()函数将参数guide设置为FALSE,同时该函数还可以自定义填充色,一举两得。
调整条形图的条形宽度和条形间距
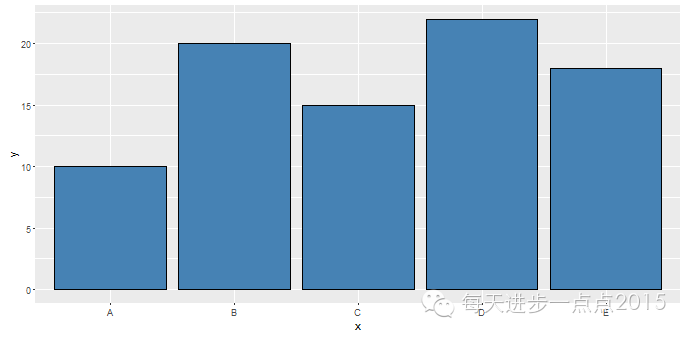
geom_bar()函数可以非常灵活的将条形图的条形宽度进行变宽或变窄设置,具体通过函数的width参数实现,width的最大值为1,默认为0.9。
x = c('A','B','C','D','E')
y = c(10,20,15,22,18)
df = data.frame(x = x , y = y)
#不作任何条形宽度的调整
ggplot(data = df, mapping = aes(x = x, y = y)) + geom_bar(stat = 'identity', fill = 'steelblue', colour = 'black')
ggplot(data = df, mapping = aes(x = x, y = y)) + geom_bar(stat = 'identity', fill = 'steelblue', colour = 'black', width = 1)
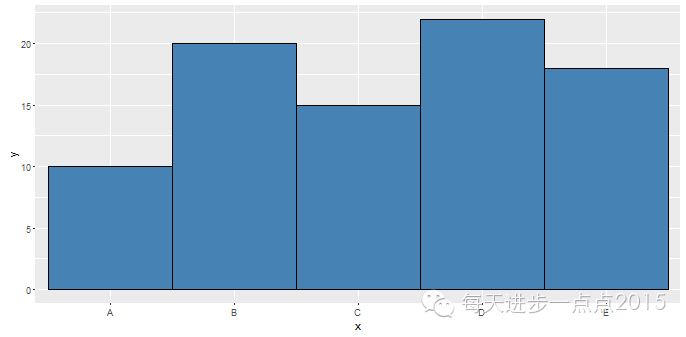
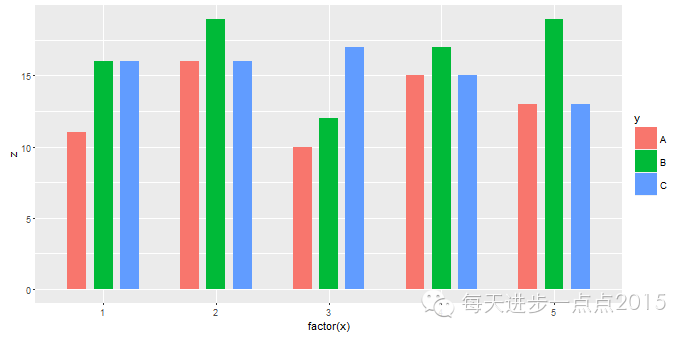
对于簇条形图来说,还可以调整条形之间的距离,默认情况下,条形图的组内条形间隔为0,具体可通过函数的position_dodge参数实现条形距离的调整,为了美观,一般将条形距离设置的比条形宽度大一点。
x <- rep(1:5, each = 3)
y <- rep(c('A','B','C'),times = 5)
set.seed(1234)
z <- round(runif(min = 10, max = 20, n = 15))
df <- data.frame(x = x, y = y, z = z)
#不作任何条形宽度和条形距离的调整
ggplot(data = df, mapping = aes(x = factor(x), y = z, fill = y)) + geom_bar(stat = 'identity', position = 'dodge')
ggplot(data = df, mapping = aes(x = factor(x), y = z, fill = y)) + geom_bar(stat = 'identity', width = 0.5, position = position_dodge(0.7))
添加数据标签
geom_text()函数可以方便的在图形中添加数值标签,具体微调从几个案例开始:
x <- rep(1:5, each = 3)
y <- rep(c('A','B','C'),times = 5)
set.seed(1234)
z <- round(runif(min = 10, max = 20, n = 15))
df <- data.frame(x = x, y = y, z = z)
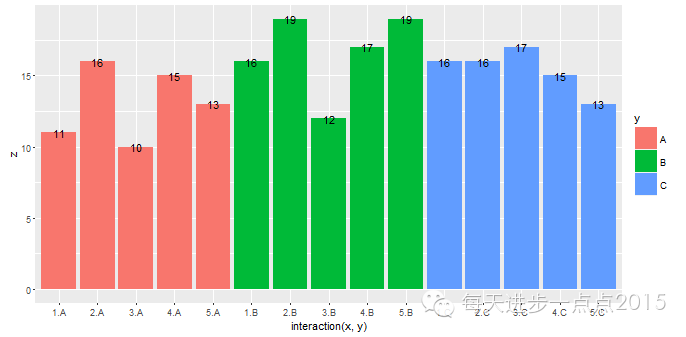
ggplot(data = df, mapping = aes(x = interaction(x,y), y = z, fill = y)) + geom_bar(stat = 'identity') + geom_text(mapping = aes(label = z))
ggplot(data = df, mapping = aes(x = interaction(x,y), y = z, fill = y)) + geom_bar(stat = 'identity') + ylim(0,max(z)+1) + geom_text(mapping = aes(label = z), size = 8, colour = 'orange', vjust = 1)
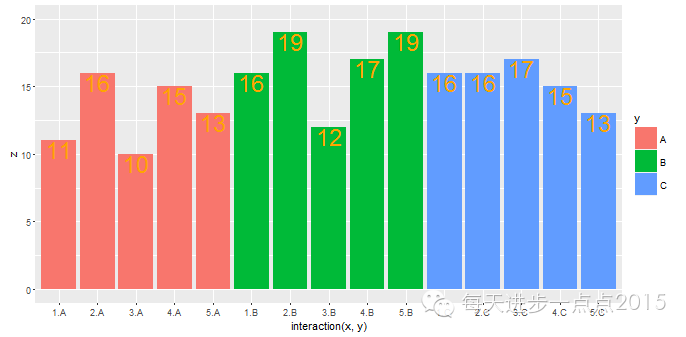
ylim设置条形图中y轴的范围;size调整标签字体大小,默认值为5号;colour更换标签颜色;vjust调整标签位置,1为分界线,越大于1,标签越在条形图上界下方,反之则越在条形图上上界上方。
对于水平交错的簇条形图,必须通过geom_text()函数中的position_dodge()参数来调整标签位置,hjust=0.5将标签水平居中放置。
ggplot(data = df, mapping = aes(x = x, y = z, fill = y)) + geom_bar(stat = 'identity', position = 'dodge') + geom_text(mapping = aes(label = z), size = 5, colour = 'black', vjust = 1, hjust = .5, position = position_dodge(0.9))
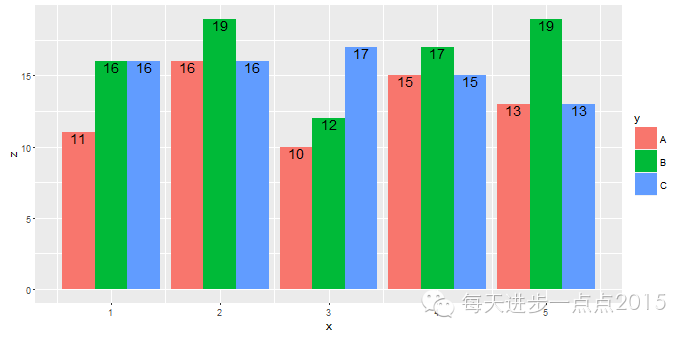
这里的图形位置与标签位置摆放必须一致,即图形位置geom_bar()函数中的position = 'dodge'参数,标签位置geom_text()函数中的position = position_dodge(0.9)参数。
对于堆叠的簇条形图,必须通过geom_text()函数中的position_stack()参数来调整标签位置,hjust=0.5将标签水平居中放置。
ggplot(data = df, mapping = aes(x = x, y = z, fill = y)) + geom_bar(stat = 'identity', position = 'stack') + geom_text(mapping = aes(label = z), size = 5, colour = 'black', vjust = 3.5, hjust = .5, position = position_stack())
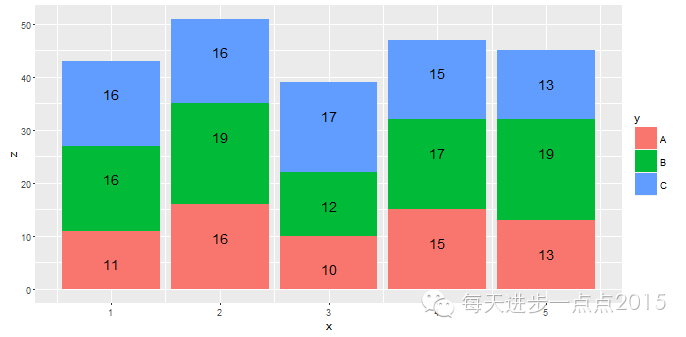
这里的图形位置与标签位置摆放必须一致,即图形位置geom_bar()函数中的position = 'stack'参数,标签位置geom_text()函数中的position = position_stack()参数。
参考资料
R数据可视化手册
R语言_ggplot2:数据分析与图形艺术
