OpenCV讲解
OpenCV讲解
- 环境配置地址
- 图像读取-显示-保存
-
- 数据读取-图像
- 图像的显示
- 图像的保存
- 数据读取-视频
- 截取部分图像数据
- 颜色通道提取
- 图像的融合
- 图像尺寸设置
- 图像处理
-
- 图像阈值
- 图像平滑
- 形态学处理
-
- 腐蚀
- 膨胀
- 开运算和闭运算
- 礼帽和黑帽
- 图像梯度
-
- Sobel算子
- Scharr算子
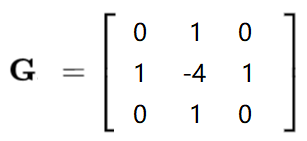
- laplacian算子
- Canny边缘检测
- 图像金字塔
- 图像轮廓
- 绘制边界
-
- 绘制边界矩形
- 绘制边界圆
- 模板匹配
-
- 匹配多个对象
- 直方图
-
- 直方图均衡化
- 自适应直方图均值化
- 傅里叶变化
-
- 低通滤波器
- 高通滤波器
主要讲解python中OpenCV的相关函数,使用的
OpenCV3OpenCV4版本。
欢迎大家去我的主页查看其他文章
环境配置地址
- Anaconda
- Python_whl
- PyCharm
图像读取-显示-保存
数据读取-图像
- cv2.IMREAD_COLOR:彩色图像
- cv2.IMREAD_GRAYSCALE:灰度图像
import cv2
import matplotlib.pyplot as plt
import numpy as np
# 读取彩色图像
img = cv2.imread("1.jpg", cv2.IMREAD_COLOR)
# 读取灰度图像
img2 =cv2.imread('2.jpg',cv2.IMREAD_GRAYSCALE)
图像的显示
#图像的显示,也可以创建多个窗口
cv2.imshow('image',img)
# 等待时间,毫秒级,0表示任意键终止
cv2.waitKey(0)
cv2.destroyAllWindows()
图像的保存
#保存
cv2.imwrite('my_img.jpg',img)
数据读取-视频
- cv2.VideoCapture可以捕获摄像头,用数字来控制不同的设备,例如0,1。
- 如果是视频文件,直接指定好路径即可。
# 读取摄像头
# vc = cv2.VideoCapture(0)
# 读取视频
vc = cv2.VideoCapture('test.mp4')
# 检查是否打开正确
if vc.isOpened():
    open, frame = vc.read()
else:
    open = False
while open:
    ret, frame = vc.read()
    if frame is None:
        break
    if ret == True:
        gray = cv2.cvtColor(frame,  cv2.COLOR_BGR2GRAY)
        cv2.imshow('result', gray)
        # 等待1000ms或者按下按键ESC时退出
        if cv2.waitKey(1000) & 0xFF == 27:
            break
vc.release()
cv2.destroyAllWindows()
截取部分图像数据
def cv_show(name,img):
    cv2.imshow(name,img)
    cv2.waitKey(0)
    cv2.destroyAllWindows()
img=cv2.imread('cat.jpg')
# 截取图片
cat=img[0:50,0:200]
cv_show('cat',cat)
颜色通道提取
b,g,r=cv2.split(img)
img=cv2.merge((b,g,r))
# 只保留R
cur_img = img.copy()
cur_img[:,:,0] = 0
cur_img[:,:,1] = 0
# 只保留G
cur_img = img.copy()
cur_img[:,:,0] = 0
cur_img[:,:,2] = 0
# 只保留B
cur_img = img.copy()
cur_img[:,:,1] = 0
cur_img[:,:,2] = 0
图像的融合
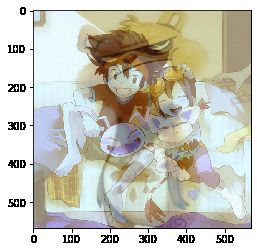
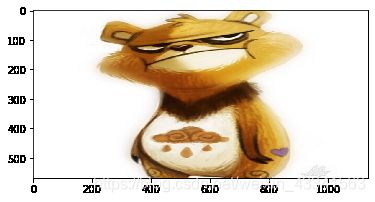
img_bear = cv2.imread("1.jpg")
img_people = cv2.imread("2.jpg")
img_bear.shape #(639, 639, 3)
img_people.shape #(568, 568, 3)
img_bear = cv2.resize(img_bear, (568,568))
img_bear.shape #(568, 568, 3)
# res=ax+by+c
res = cv2.addWeighted(img_bear, 0.4, img_people, 0.6, 0)
plt.imshow(res)
图像尺寸设置
- x轴变为两倍
res = cv2.resize(img_bear, (0, 0), fx=2, fy=1)
plt.imshow(res)
res = cv2.resize(img_bear, (0, 0), fx=1, fy=2)
plt.imshow(res)
图像处理
图像阈值
ret, dst = cv2.threshold(src, thresh, maxval, type)
- src: 输入图,只能输入单通道图像,通常来说为灰度图
- dst: 输出图
- thresh: 阈值
- maxval: 当像素值超过了阈值(或者小于阈值,根据type来决定),所赋予的值
- type:二值化操作的类型,包含以下5种类型: cv2.THRESH_BINARY; cv2.THRESH_BINARY_INV; cv2.THRESH_TRUNC; cv2.THRESH_TOZERO;cv2.THRESH_TOZERO_INV
- cv2.THRESH_BINARY 超过阈值部分取maxval(最大值),否则取0
- cv2.THRESH_BINARY_INV THRESH_BINARY的反转
- cv2.THRESH_TRUNC 大于阈值部分设为阈值,否则不变
- cv2.THRESH_TOZERO 大于阈值部分不改变,否则设为0
- cv2.THRESH_TOZERO_INV THRESH_TOZERO的反转
img_gray = cv2.imread("2.jpg", cv2.IMREAD_GRAYSCALE)
res, thresh1 = cv2.threshold(img_gray, 127, 255, cv2.THRESH_BINARY)
res, thresh2 = cv2.threshold(img_gray, 127, 255, cv2.THRESH_BINARY_INV)
res, thresh3 = cv2.threshold(img_gray, 127, 255, cv2.THRESH_TRUNC)
res, thresh4 = cv2.threshold(img_gray, 127, 255, cv2.THRESH_TRIANGLE)
res, thresh5 = cv2.threshold(img_gray, 127, 255, cv2.THRESH_TOZERO)
res, thresh6 = cv2.threshold(img_gray, 127, 255, cv2.THRESH_TOZERO_INV)
# res, thresh7 = cv2.threshold(img_gray, 127, 255, cv2.THRESH_MASK)
# res, thresh8 = cv2.threshold(img_gray, 127, 255, cv2.THRESH_OTSU)
titles = ['Original Image', 'BINARY', 'BINARY_INV', 'TRUNC', 'TRIANGLE','TOZERO', 'TOZERO_INV','MASK','OTSU']
images = [img_gray, thresh1, thresh2, thresh3, thresh4, thresh5, thresh6, thresh7, thresh8]

for i in range(6):
    plt.subplot(2, 3, i + 1)
    plt.imshow(images[i], 'gray')
    plt.title(titles[i])
    plt.xticks([]), plt.yticks([])
plt.show()
图像平滑
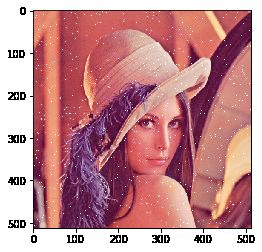
img = cv2.imread("lenaNoise.png")
plt.imshow(img[:,:,(2,1,0)])
# 均值滤波
# 简单的平均卷积操作
blur = cv2.blur(img, (3, 3))
# cv_show('blur', blur)
# 方框滤波
# 基本和均值一样,可以选择归一化,容易越界
box = cv2.boxFilter(img,-1,(3,3), normalize=False)
# 方框滤波
# 基本和均值一样,可以选择归一化
box = cv2.boxFilter(img,-1,(3,3), normalize=True)
# 高斯滤波
# 高斯模糊的卷积核里的数值是满足高斯分布,相当于更重视中间的
aussian = cv2.GaussianBlur(img, (5, 5), 1)
# 中值滤波
# 相当于用中值代替
median = cv2.medianBlur(img, 5)  # 中值滤波,指定大小是5×5
# 展示所有的
res = np.hstack((blur,aussian,median))
plt.imshow(res[:,:,(2,1,0)])
形态学处理
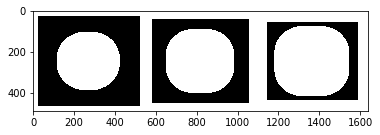
腐蚀
img = cv2.imread('dige.png')
kernel = np.ones((30,30), np.uint8)
erosion_1 = cv2.erode(pie, kernel, iterations=1)# 腐蚀1次
erosion_2 = cv2.erode(pie,kernel,iterations = 2)# 2次
erosion_3 = cv2.erode(pie,kernel,iterations = 3)# 3次
res = np.hstack((erosion_1, erosion_2, erosion_3))
plt.imshow(res[:,:,(2,1,0)])
膨胀
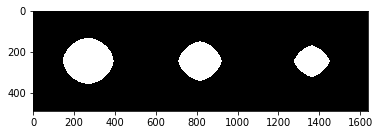
pie = cv2.imread('pie.png')
kernel = np.ones((30,30),np.uint8)
dilate_1 = cv2.dilate(pie,kernel,iterations = 1)
dilate_2 = cv2.dilate(pie,kernel,iterations = 2)
dilate_3 = cv2.dilate(pie,kernel,iterations = 3)
res = np.hstack((dilate_1,dilate_2,dilate_3))
plt.imshow(res[:,:,(2,1,0)])
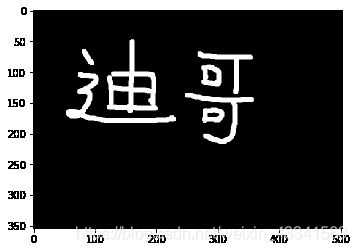
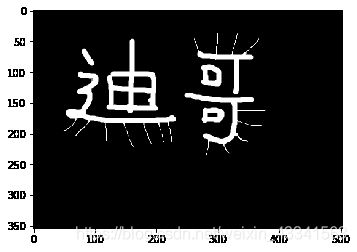
开运算和闭运算
# 开:先腐蚀,再膨胀
img = cv2.imread('dige.png')
kernel = np.ones((5,5),np.uint8)
opening = cv2.morphologyEx(img, cv2.MORPH_OPEN, kernel)
plt.imshow(opening)
# 闭:先膨胀,再腐蚀
img = cv2.imread('dige.png')
kernel = np.ones((5,5),np.uint8)
closing = cv2.morphologyEx(img, cv2.MORPH_CLOSE, kernel)
plt.imshow(closing)
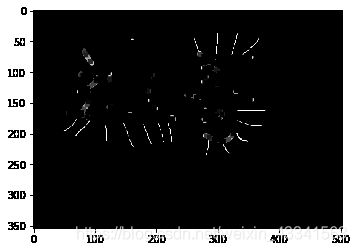
礼帽和黑帽
- 礼帽 = 原始输入-开运算结果
- 黑帽 = 闭运算-原始输入
#礼帽
img = cv2.imread('dige.png')
tophat = cv2.morphologyEx(img, cv2.MORPH_TOPHAT, kernel)
plt.imshow(tophat)
#黑帽
img = cv2.imread('dige.png')
blackhat  = cv2.morphologyEx(img,cv2.MORPH_BLACKHAT, kernel)
plt.imshow(tophat)
图像梯度
Sobel算子

dst = cv2.Sobel(src, ddepth, dx, dy, ksize)
- ddepth:图像的深度
- dx和dy分别表示水平和竖直方向
- ksize是Sobel算子的大小
sobelx = cv2.Sobel(img,cv2.CV_64F,1,0,ksize=3)
sobelx = cv2.convertScaleAbs(sobelx)
sobely = cv2.Sobel(img,cv2.CV_64F,0,1,ksize=3)
sobely = cv2.convertScaleAbs(sobely)
# 分别计算x和y,再求和
sobelxy = cv2.addWeighted(sobelx,0.5,sobely,0.5,0)
plt.imshow(sobelxy)
# 不建议直接计算
sobelxy=cv2.Sobel(img,cv2.CV_64F,1,1,ksize=3)
sobelxy = cv2.convertScaleAbs(sobelxy)
plt.imshow(sobelxy)
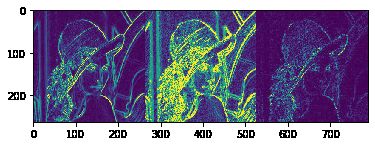
Scharr算子
laplacian算子
img = cv2.imread("lena.jpg", cv2.IMREAD_GRAYSCALE)
sobelx = cv2.Sobel(img,cv2.CV_64F,1,0,ksize=3)
sobely = cv2.Sobel(img,cv2.CV_64F,0,1,ksize=3)
sobelx = cv2.convertScaleAbs(sobelx)
sobely = cv2.convertScaleAbs(sobely)
sobelxy = cv2.addWeighted(sobelx,0.5,sobely,0.5,0)

scharrx = cv2.Scharr(img, cv2.CV_64F,1,0)
scharry = cv2.Scharr(img, cv2.CV_64F,0,1)
scharrx = cv2.convertScaleAbs(scharrx)
scharry = cv2.convertScaleAbs(scharry)
scharrxy = cv2.addWeighted(scharrx,0.5,scharry,0.5,0)

laplacian = cv2.Laplacian(img,cv2.CV_64F)
laplacian = cv2.convertScaleAbs(laplacian)

res = np.hstack((sobelxy,scharrxy,laplacian))
plt.imshow(res)
Canny边缘检测
-
- 使用高斯滤波器,以平滑图像,滤除噪声。
-
- 计算图像中每个像素点的梯度强度和方向。
-
- 应用非极大值(Non-Maximum Suppression)抑制,以消除边缘检测带来的杂散响应。
-
- 应用双阈值(Double-Threshold)检测来确定真实的和潜在的边缘。
-
- 通过抑制孤立的弱边缘最终完成边缘检测。
1.高斯滤波

2.梯度和方向

3.非极大值抑制


4.双阈值检测

img = cv2.imread("lena.jpg", cv2.IMREAD_GRAYSCALE)
v1 = cv2.Canny(img, 80,150)
v2 = cv2.Canny(img, 50,100)
res = np.hstack((v1,v2))
plt.imshow(res)
# cv_show(res, 'res')
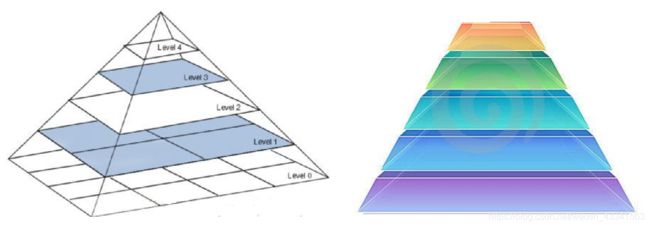
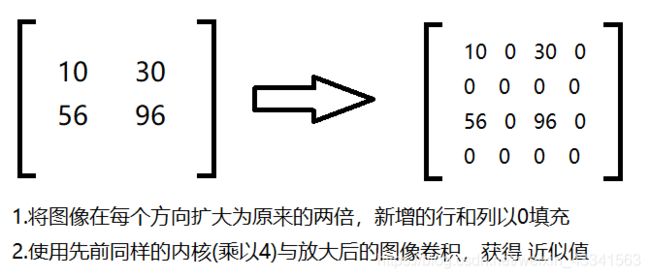
图像金字塔
img = cv2.imread("1.jpg")
#下采样
down = cv2.pyrDown(img)
# 上采样
up = cv2.pyrUp(img)
# 先上采样再下采样
up=cv2.pyrUp(img)
up_down=cv2.pyrDown(up)
cv_show(up_down,'up_down')
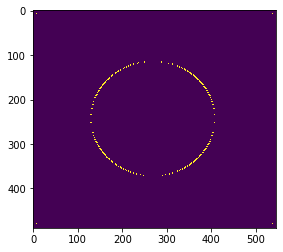
图像轮廓
cv2.findContours(img,mode,method)
mode:轮廓检索模式
- RETR_EXTERNAL :只检索最外面的轮廓;
- RETR_LIST:检索所有的轮廓,并将其保存到一条链表当中;
- RETR_CCOMP:检索所有的轮廓,并将他们组织为两层:顶层是各部分的外部边界,第二层是空洞的边界;
- RETR_TREE:检索所有的轮廓,并重构嵌套轮廓的整个层次;(一般使用这个)
method:轮廓逼近方法
- CHAIN_APPROX_NONE:以Freeman链码的方式输出轮廓,所有其他方法输出多边形(顶点的序列)。
- CHAIN_APPROX_SIMPLE:压缩水平的、垂直的和斜的部分,也就是,函数只保留他们的终点部分。
[外链图片转存失败,源站可能有防盗链机制,建议将图片保存下来直接上传(img-6qBrW1I4-1578111949155)(chain.png)]
一般都是使用二值图像进行轮廓检测
img = cv2.imread("contours.png")
gray = cv2.cvtColor(img, cv2.COLOR_BGR2GRAY)
ret, thresh = cv2.threshold(gray, 127, 255, cv2.THRESH_BINARY)
# contours:轮廓的内容,hierarchy:层级(用不上)
contours, hierarchy = cv2.findContours(thresh, cv2.RETR_TREE, cv2.CHAIN_APPROX_NONE)
#传入绘制图像,轮廓,轮廓索引,颜色模式,线条厚度
# 注意需要copy,要不原图会变。。。
draw_img = img.copy()
res = cv2.drawContours(draw_img, contours, -1, (0, 255, 0), 2)
cv_show(res, 'res')
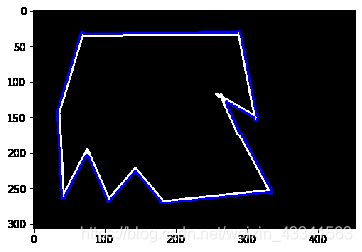
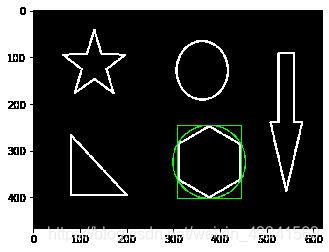
绘制边界
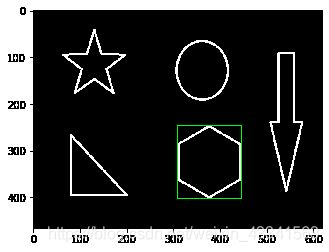
绘制边界矩形
img = cv2.imread('contours.png')

gray = cv2.cvtColor(img, cv2.COLOR_BGR2GRAY)
ret, thresh = cv2.threshold(gray, 127, 255, cv2.THRESH_BINARY)
contours, hierarchy = cv2.findContours(thresh, cv2.RETR_TREE, cv2.CHAIN_APPROX_NONE)
cnt = contours[2]

x,y,w,h = cv2.boundingRect(cnt)
img = cv2.rectangle(img, (x,y), (x+w,y+h), (0, 255, 0), 2)
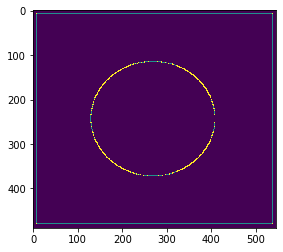
绘制边界圆
(x,y),radius = cv2.minEnclosingCircle(cnt)
center = (int(x),int(y))
radius = int(radius)
img = cv2.circle(img,center,radius,(0,255,0),2)
cv_show(img,'img')
模板匹配
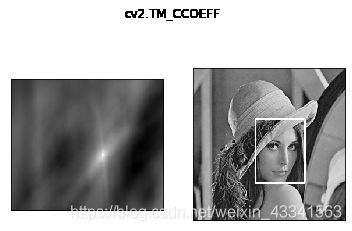
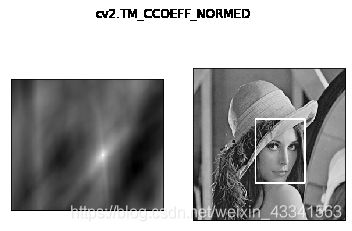
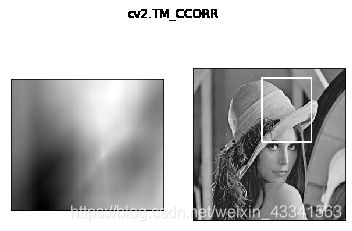
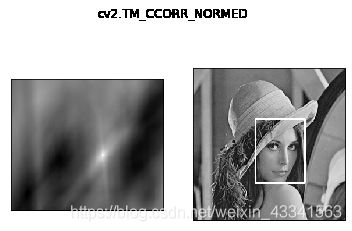
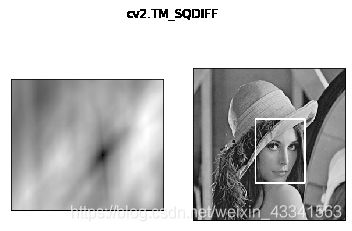
模板匹配和卷积原理很像,模板在原图像上从原点开始滑动,计算模板与(图像被模板覆盖的地方)的差别程度,这个差别程度的计算方法在opencv里有6种,然后将每次计算的结果放入一个矩阵里,作为结果输出。假如原图形是AxB大小,而模板是axb大小,则输出结果的矩阵是(A-a+1)x(B-b+1)
cv2.matchTemplate(img, template, method)
- TM_SQDIFF:计算平方不同,计算出来的值越小,越相关
- TM_CCORR:计算相关性,计算出来的值越大,越相关
- TM_CCOEFF:计算相关系数,计算出来的值越大,越相关
- TM_SQDIFF_NORMED:计算归一化平方不同,计算出来的值越接近0,越相关
- TM_CCORR_NORMED:计算归一化相关性,计算出来的值越接近1,越相关
- TM_CCOEFF_NORMED:计算归一化相关系数,计算出来的值越接近1,越相关
一般是使用有归一化的方法。相应公式
# 模板匹配
img = cv2.imread('lena.jpg', 0)
template = cv2.imread('face.jpg', 0)
h, w = template.shape[:2]
methods = ['cv2.TM_CCOEFF', 'cv2.TM_CCOEFF_NORMED', 'cv2.TM_CCORR',
           'cv2.TM_CCORR_NORMED', 'cv2.TM_SQDIFF', 'cv2.TM_SQDIFF_NORMED']
for meth in methods:
    img2 = img.copy()

    # 匹配方法的真值
    method = eval(meth)
    print (method)
    res = cv2.matchTemplate(img, template, method)
    min_val, max_val, min_loc, max_loc = cv2.minMaxLoc(res)

    # 如果是平方差匹配TM_SQDIFF或归一化平方差匹配TM_SQDIFF_NORMED,取最小值
    if method in [cv2.TM_SQDIFF, cv2.TM_SQDIFF_NORMED]:
        top_left = min_loc
    else:
        top_left = max_loc
    bottom_right = (top_left[0] + w, top_left[1] + h)

    # 画矩形
    cv2.rectangle(img2, top_left, bottom_right, 255, 2)

    plt.subplot(121), plt.imshow(res, cmap='gray')# 匹配的结果
    plt.xticks([]), plt.yticks([])  # 隐藏坐标轴
    plt.subplot(122), plt.imshow(img2, cmap='gray')# 在原图中画出匹配的结果
    plt.xticks([]), plt.yticks([])
    plt.suptitle(meth)
    plt.show()
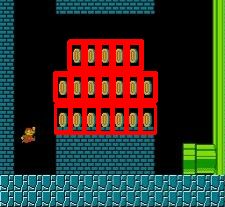
匹配多个对象
img_rgb = cv2.imread('mario.jpg')
img_gray = cv2.cvtColor(img_rgb, cv2.COLOR_BGR2GRAY)
template = cv2.imread('mario_coin.jpg', 0)
h, w = template.shape[:2]

res = cv2.matchTemplate(img_gray, template, cv2.TM_CCOEFF_NORMED)
threshold = 0.8
# 取匹配程度大于%80的坐标
loc = np.where(res >= threshold)
for pt in zip(*loc[::-1]):  # *号表示可选参数
    bottom_right = (pt[0] + w, pt[1] + h)
    cv2.rectangle(img_rgb, pt, bottom_right, (0, 0, 255), 2)
cv2.imshow('img_rgb', img_rgb)
cv2.waitKey(0)
直方图

cv2.calcHist(images,channels,mask,histSize,ranges)
- images: 原图像图像格式为 uint8 或 float32。当传入函数时应用中括号[]括,例如[img]
- channels: 同样用中括号括来它会告函数我们统幅图像的直方图。如果入图像是灰度图它的值就是[0]如果是彩色图像的传入的参数可以是[0][1][2]它们分别对应着BGR。
- mask: 掩模图像。统整幅图像的直方图就把它为None。但是如果你想统图像某一分的直方图的你就制作一个掩模图像并 使用它。
- histSize:BIN的数目。也应用中括号括
- ranges: 像素值范围常为[0-256]
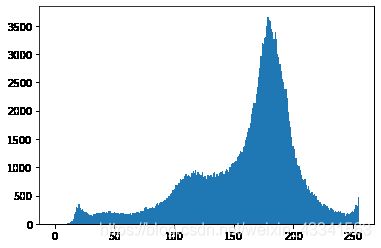
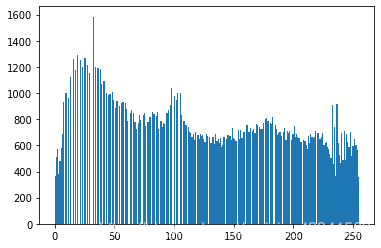
img = cv2.imread('cat.jpg',0) #0表示灰度图
hist = cv2.calcHist([img],[0],None,[256],[0,256])
# ravel()是将二维矩阵展成一维数组
plt.hist(img.ravel(),256);
plt.show()
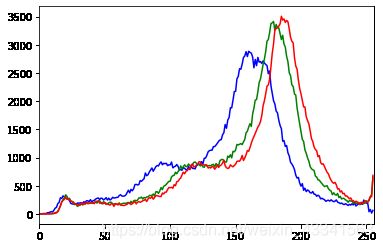
img = cv2.imread('cat.jpg')
color = ('b','g','r')
for i,col in enumerate(color):
    histr = cv2.calcHist([img],[i],None,[256],[0,256])
    plt.plot(histr,color = col)
    plt.xlim([0,256])
# 创建mast
img = cv2.imread('cat.jpg')
mask = np.zeros(img.shape[:2], np.uint8)
mask[100:300, 100:400] = 255
img = cv2.imread('cat.jpg', 0)
masked_img = cv2.bitwise_and(img, img, mask=mask)#与操作
hist_full = cv2.calcHist([img], [0], None, [256], [0, 256])
hist_mask = cv2.calcHist([img], [0], mask, [256], [0, 256])
plt.subplot(221), plt.imshow(img, 'gray')
plt.subplot(222), plt.imshow(mask, 'gray')
plt.subplot(223), plt.imshow(masked_img, 'gray')
plt.subplot(224), plt.plot(hist_full), plt.plot(hist_mask)
plt.xlim([0, 256])
plt.show()
直方图均衡化
img = cv2.imread('clahe.jpg',0) #0表示灰度图 #clahe
plt.hist(img.ravel(),256);
plt.show()
equ = cv2.equalizeHist(img)
plt.hist(equ.ravel(),256)
plt.show()
res = np.hstack((img,equ))
cv_show('res',res)
自适应直方图均值化
clahe = cv2.createCLAHE(clipLimit=2.0, tileGridSize=(8,8))
res_clahe = clahe.apply(img)
res = np.hstack((img,equ,res_clahe))
cv_show('res',res)
傅里叶变化
我们生活在时间的世界中,早上7:00起来吃早饭,8:00去挤地铁,9:00开始上班。。。以时间为参照就是时域分析。
但是在频域中一切都是静止的!
傅里叶变化讲解
傅里叶变换的作用
- 高频:变化剧烈的灰度分量,例如边界
- 低频:变化缓慢的灰度分量,例如一片大海
滤波
- 低通滤波器:只保留低频,会使得图像模糊
- 高通滤波器:只保留高频,会使得图像细节增强
傅里叶变化步骤
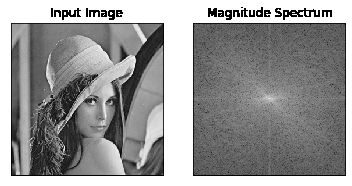
- opencv中主要就是cv2.dft()和cv2.idft(),输入图像需要先转换成np.float32 格式。
- 得到的结果中频率为0的部分会在左上角,通常要转换到中心位置,可以通过shift变换来实现。
- cv2.dft()返回的结果是双通道的(实部,虚部),通常还需要转换成图像格式才能展示(0,255)。
import numpy as np
import cv2
from matplotlib import pyplot as plt

img = cv2.imread('lena.jpg',0)
# 将输入图像需要先转换成np.float32 格式
img_float32 = np.float32(img)

dft = cv2.dft(img_float32, flags = cv2.DFT_COMPLEX_OUTPUT)
# 通过shift变换,将结果转换到中心位置
dft_shift = np.fft.fftshift(dft)
# 得到灰度图能表示的形式
magnitude_spectrum = 20*np.log(cv2.magnitude(dft_shift[:,:,0],dft_shift[:,:,1]))

plt.subplot(121),plt.imshow(img, cmap = 'gray')
plt.title('Input Image'), plt.xticks([]), plt.yticks([])
plt.subplot(122),plt.imshow(magnitude_spectrum, cmap = 'gray')
plt.title('Magnitude Spectrum'), plt.xticks([]), plt.yticks([])
plt.show()
低通滤波器
import numpy as np
import cv2
from matplotlib import pyplot as plt

img = cv2.imread('lena.jpg',0)

img_float32 = np.float32(img)

dft = cv2.dft(img_float32, flags = cv2.DFT_COMPLEX_OUTPUT)
dft_shift = np.fft.fftshift(dft)

rows, cols = img.shape
crow, ccol = int(rows/2) , int(cols/2)     # 中心位置

# 低通滤波
mask = np.zeros((rows, cols, 2), np.uint8)
mask[crow-30:crow+30, ccol-30:ccol+30] = 1

# IDFT
fshift = dft_shift*mask
f_ishift = np.fft.ifftshift(fshift)
img_back = cv2.idft(f_ishift)
img_back = cv2.magnitude(img_back[:,:,0],img_back[:,:,1])

plt.subplot(121),plt.imshow(img, cmap = 'gray')
plt.title('Input Image'), plt.xticks([]), plt.yticks([])
plt.subplot(122),plt.imshow(img_back, cmap = 'gray')
plt.title('Result'), plt.xticks([]), plt.yticks([])

plt.show()
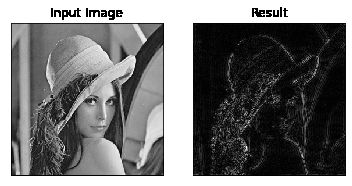
高通滤波器
img = cv2.imread('lena.jpg',0)

img_float32 = np.float32(img)

dft = cv2.dft(img_float32, flags = cv2.DFT_COMPLEX_OUTPUT)
dft_shift = np.fft.fftshift(dft)

rows, cols = img.shape
crow, ccol = int(rows/2) , int(cols/2)     # 中心位置

# 高通滤波
mask = np.ones((rows, cols, 2), np.uint8)
mask[crow-30:crow+30, ccol-30:ccol+30] = 0

# IDFT
fshift = dft_shift*mask
f_ishift = np.fft.ifftshift(fshift)
img_back = cv2.idft(f_ishift)
img_back = cv2.magnitude(img_back[:,:,0],img_back[:,:,1])

plt.subplot(121),plt.imshow(img, cmap = 'gray')
plt.title('Input Image'), plt.xticks([]), plt.yticks([])
plt.subplot(122),plt.imshow(img_back, cmap = 'gray')
plt.title('Result'), plt.xticks([]), plt.yticks([])

plt.show()
