python教程-数据分析-matplotlib绘制折线图2 +总结(搭建网格,加上图例,修改图片的颜色和线条,脑图总结)
上一篇博客我们展示到了如何将matplotlib里面的中文正确输出
链接上一篇:python教程-数据分析-matplotlib绘制折线图1
matplotlib
- 今天这一篇我们继续学习matplotlib绘制折线图
-
- 一、续上昨天的:添加xy轴的描述信息
- 案例
-
- 二、按照昨天学习内容进行改进
- 今日学的修改内容
-
- 1、搭建网格
-
- 修改网格的线条
- 2、加上图例
- 3、修改代码的线条和颜色
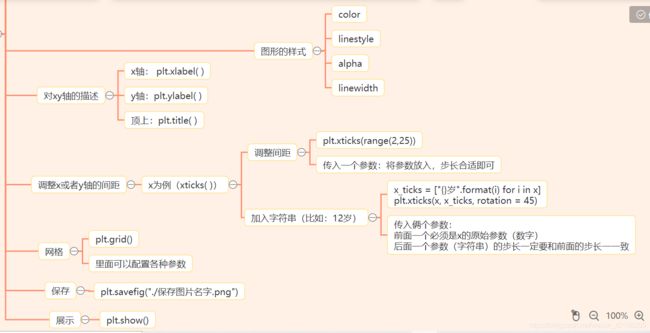
- 总结(脑图)
今天这一篇我们继续学习matplotlib绘制折线图
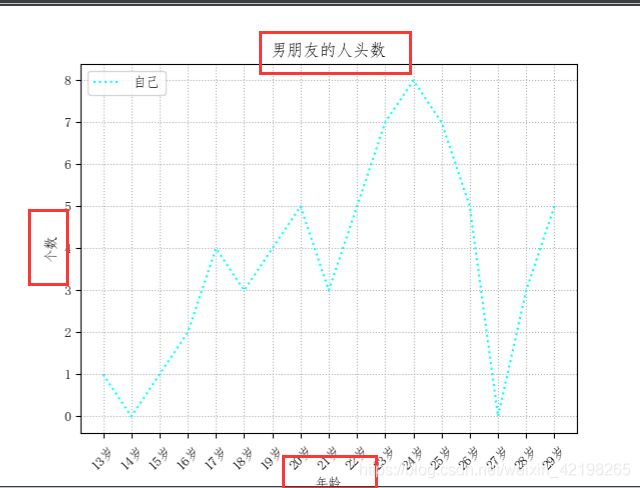
一、续上昨天的:添加xy轴的描述信息
使用的代码:
plt.title("男朋友的人头数") #设置标题
plt.xlabel("年龄") #设置x轴
plt.ylabel("个数") #设置y轴
案例
题目:统计13-30岁期间,男朋友的个数,头数的汇众已经给出:[1, 0, 1, 2, 4, 3, 4, 5, 3, 5, 7, 8, 7, 5, 0, 3, 5],请为此绘制折线图
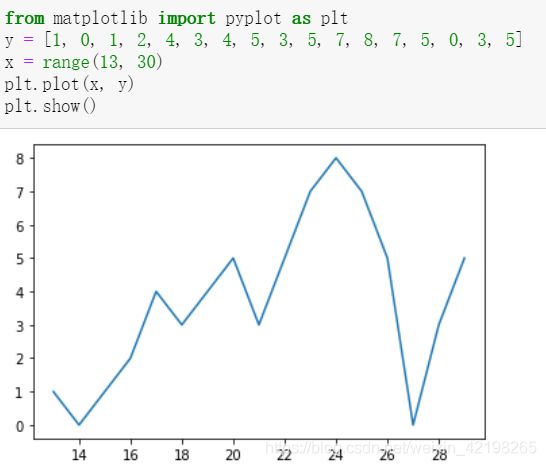
最基础的:
from matplotlib import pyplot as plt
y = [1, 0, 1, 2, 4, 3, 4, 5, 3, 5, 7, 8, 7, 5, 0, 3, 5]
x = range(13, 30)
plt.plot(x, y)
plt.show()
二、按照昨天学习内容进行改进
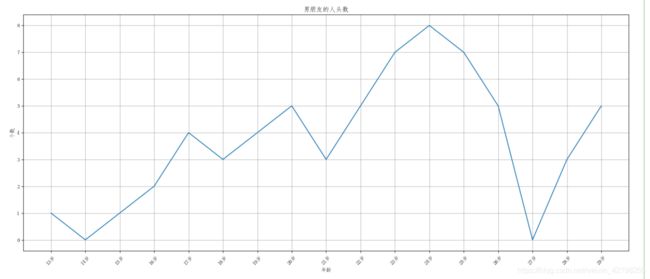
#导入包
from matplotlib import pyplot as plt

# 显示中文
from pylab import mpl
mpl.rcParams['font.sans-serif'] = ['FangSong'] # 指定默认字体
mpl.rcParams['axes.unicode_minus'] = False # 解决保存图像是负号'-'显示为方块的问题

# 确定xy的具体值
y = [1, 0, 1, 2, 4, 3, 4, 5, 3, 5, 7, 8, 7, 5, 0, 3, 5]
x = range(13, 30)

# 改变图片大小
plt.figure(figsize=(20,8), dpi=80)

#设置图片的标签(标题)
plt.title("男朋友的人头数")
plt.xlabel("年龄")
plt.ylabel("个数")

# 将字符串的参数传入下框列表
x_ticks = ["{}岁".format(i) for i in x]
plt.xticks(x, x_ticks, rotation = 45)

# 绘制图片
plt.plot(x, y)

# 保存图片
plt.savefig("./男朋友数量分布.png")

# 展示图片
plt.show()
今日学的修改内容
1、搭建网格
使用代码:
plt.grid() # 显示网格,放入show()方法的前面
修改网格的线条
代码:
plt.grid(linestyle = ":")#传入一个参数即可
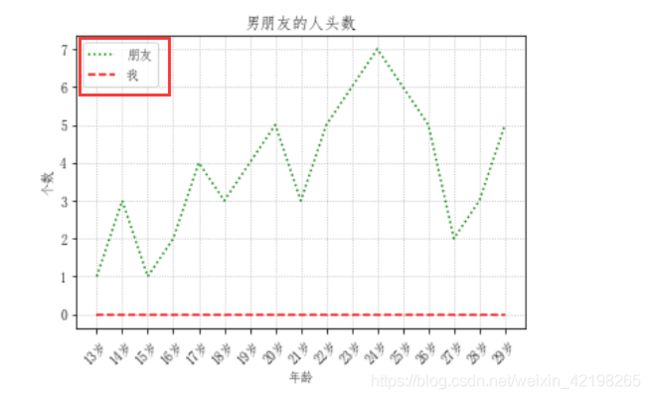
2、加上图例
plt.plot(x, y1, label="朋友")
plt.plot(x, y2, label="我")
plt.legend(loc = "upper left")
- 1、先在plot里面传入标签参数,自己定义参数的值
- 2、然后在图形建立好的时候,加上legend的代码
- 也可以直接写plt.legend(),这样他会默认一个最佳的位置放置图例
- 但是如果你想要换的话,就在里面添加参数,直接Ctrl+B进入文档,里面就有解释的
3、修改代码的线条和颜色
plt.plot(x, y1, label="朋友", color = "g", linestyle=":")
plt.plot(x, y2, label="我", color = "r", linestyle="--")
颜色的RGB可以搜索对应的十六进制的数字,更换即可
链接:颜色的RGB的十六进制值
嘿嘿,喜欢粉嘟嘟的,那就贴一张粉嘟嘟的吧!

- 修改线条的样式用:linestyle = “:”(一些特殊符号)
- 修改线条的透明度用:alpha = 0.4(一个值)
- 修改线条的粗细用:linewidth = 5(传入一个值)
