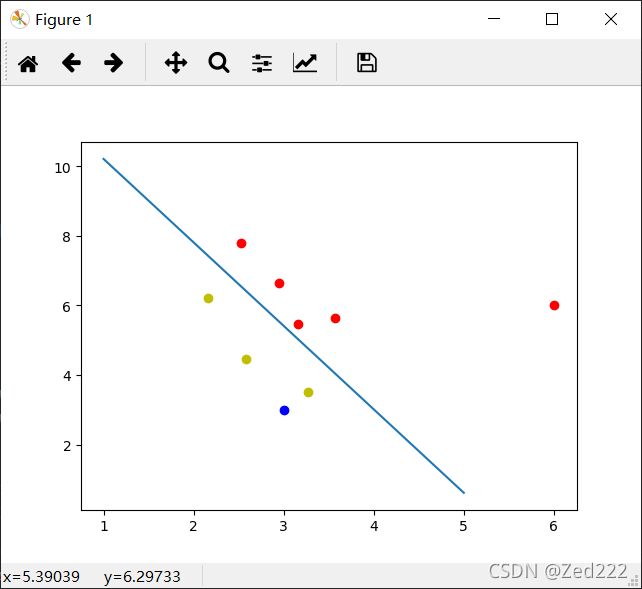
人工智能学习笔记 Fisher 线性分类器的设计与实现 实例1
学习来源:
线性判别分析LDA原理总结 - 刘建平Pinard - 博客园
Fisher 线性分类器的设计与实现_海绵的博客-CSDN博客
一、实验内容
二、基本思想
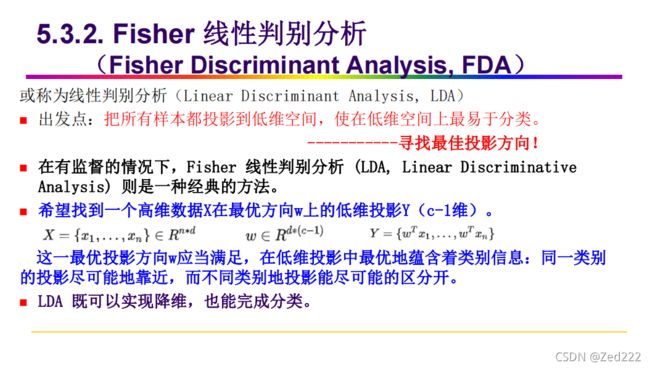
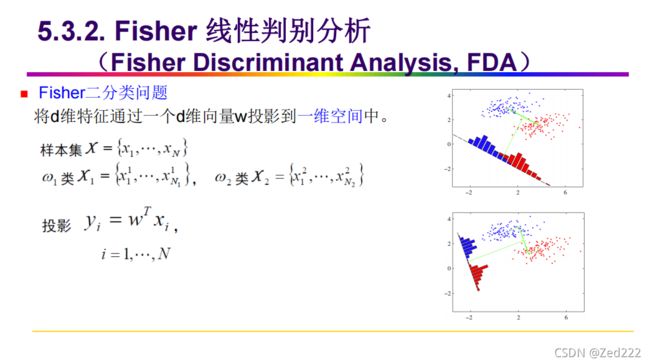
若把样本的多维特征空间的点投影到一条直线上,就能把特征空间压缩成一维。那么关
键就是找到这条直线的方向,找得好,分得好,找不好,就混在一起。因此
fisher
方法目标
就是找到这个最好的直线方向以及如何实现向最好方向投影的变换。这个投影变换恰是我们
所寻求的解向量 ,这是
fisher
算法的基本问题。
样本训练集以及待测样本的特征数目为 n
。为了找到最佳投影方向,需要计算出各类均
值、样本类内离散度矩阵 和总类间离散度矩阵、样本类间离散度矩阵,根据
Fisher
准则,
找到最佳投影准则,将训练集内所有样本进行投影,投影到一维
Y
空间,由于
Y
空间是一维
的,则需要求出
Y
空间的划分边界点,找到边界点后,就可以对待测样本进行一维
Y
空间的
投影,判断它的投影点与分界点的关系,将其归类。
三、实现步骤
实验
1
:利用
LDA
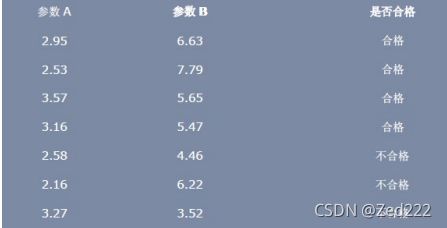
进行一个分类的问题:假设一个产品有两个参数柔软性
A
和钢性
B
来衡量它是否合格,如下图所示:
根据上图,我们可以把样本分为两类,一类是合格的产品,一类是不合格的产品。通过
LDA
算法对训练样本的投影获得判别函数,然后判断测试样本的类别,即输入一个样本
的参数,判断该产品是否合格
0.先对样本预处理
w1 = np.mat([[2.95, 6.63], [2.53, 7.79], [3.57, 5.65],[3.16,5.47]])
w2 = np.mat([[2.58, 4.46], [2.16, 6.22], [3.27, 3.52]])
#转化为两行 其中每行的数据为 在一个类内同一个特征不同样本的值
#两行数据代表一个类内两个特征不同样本的值
w1=w1.T
w2=w2.T

sz1 = np.size(w1,1)
sz2 = np.size(w2,1)
1.计算均值
#  1.求wi均值
    m1 = np.mean(w1, axis=1)
m2 = np.mean(w2, axis=1)2.计算样本类内离散度矩阵 Si 和总类内离散度矩阵 Sw
# 2.计算样本内离散度 Si 和总类内离散度矩阵 Sw

#初始化si
s1 = np.zeros((w1.shape[0],w1.shape[0]))
s2 = np.zeros((w2.shape[0],w2.shape[0]))

#g根据公式计算
for i in range(w1.shape[1]):#共有w1.shape[1]个样本
        tmp = w1[:,i] - m1
        s1 = s1 + tmp * tmp.T
for i in range(w2.shape[1]):
        tmp = w2[:,i] - m2
        s2 = s2 + tmp * tmp.T
sw = (sz1*s1 + sz2*s2)/(sz1+sz2)3.计算样本类间离散度矩阵 Sb
sb = (m1 - m2) * (m1 - m2).T4.求向量W*
w_star = np.linalg.inv(sw) * (m1-m2)
5.将训练集内所有样本进行求类均值 求W0
    #计算类均值
    res1=0
    for i in range(sz1):
        res1 = res1 + w1[:,i].T*w_star
    res1/=sz1

    res2=0
    for i in range(sz2):
        res2 = res2 +w2[:,i].T*w_star
    res2/=sz2

return -(res1*sz1+res2*sz2)/(sz1+sz2)
6.画出分界线和各类点
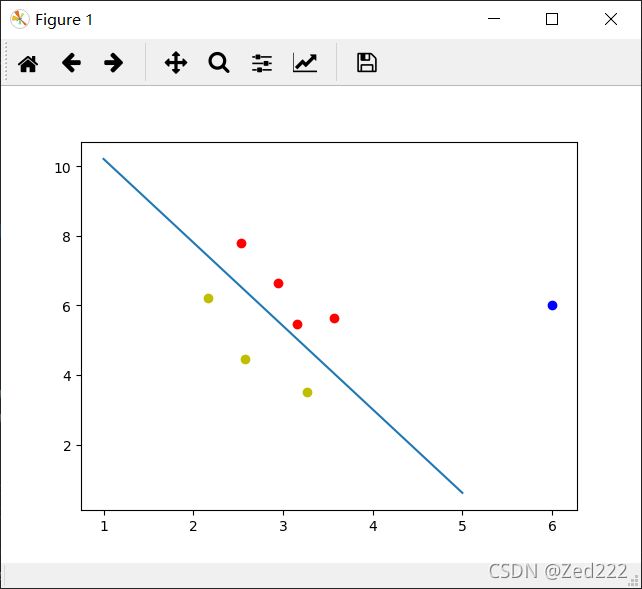
对于分界线我们把gx设为0 设x为(x,y)带入其中一个x为np.linspace(1, 5, 50)即可得另一个y
def get_line(w, w0):
    # 换两类之间的分界线

    x = np.linspace(1, 5, 50)
    print(w)
    y = -w[0,0]*x/w[1,0]-w0/w[1,0]
    y=y.reshape(-1,1)#将行向量转置
    return x, y
7.绘图
def show_fig(w):
     fig = plt.figure()
     ax1 = fig.add_subplot(111)
     ax1.scatter(np.array(w1[:,0]), np.array(w1[:,1]),c='r')
     ax1.scatter(np.array(w2[:,0]), np.array(w2[:,1]),c='y')
     ax1.plot(wx,wy)
     ax1.scatter(np.array(w[0,0]), np.array(w[0,1]),c='b')
     plt.show()
8.判断给定点的类别 并将它加到类中
def get_res(w1,w2,X, w0 ,w_star):
    res = X * w_star + w0
    if res >=0:
        print('合格')
        w1=np.append(w1, X, axis=0)
        #print(w1)
    else:

        print('不合格')
        w2=np.append(w2, X, axis=0)
return w1,w2四总函数
# -*- coding: utf-8 -*-


# 二分类问题 w1 w2

import math
import numpy as np
import matplotlib.pyplot as plt

def fisher(w1, w2):
    #将行向量转置为列向量
    w1=w1.T
    w2=w2.T

    sz1 = np.size(w1,1)
    sz2 = np.size(w2,1)

    #  1.求wi均值
    m1 = np.mean(w1, axis=1)
    m2 = np.mean(w2, axis=1)

    # 2.计算样本内离散度 Si 和总类内离散度矩阵 Sw
    s1 = np.zeros((w1.shape[0],w1.shape[0]))
    for i in range(w1.shape[1]):#共有w1.shape[1]个样本

        tmp = w1[:,i] - m1
        s1 = s1 + tmp * tmp.T

    s2 =  np.zeros((w2.shape[0],w2.shape[0]))
    for i in range(w2.shape[1]):
        tmp = w2[:,i] - m2
        s2 = s2 + tmp * tmp.T
    sw = (sz1*s1 + sz2*s2)/(sz1+sz2)

    # 3.计算样本间离散度 sb
    sb = (m1 - m2) * (m1 - m2).T

    # 4.计算w_star
    w_star = np.linalg.inv(sw) * (m1-m2)


    #计算类均值
    res1=0
    for i in range(sz1):
        res1 = res1 + w1[:,i].T*w_star
    res1/=sz1

    res2=0
    for i in range(sz2):
        res2 = res2 +w2[:,i].T*w_star
    res2/=sz2

    '''
    # 4.另外一种计算 w_star的方式,
    #求sw^(-1)*sb 的特征值,特征向量
    t = np.linalg.inv(sw)*sb
    v, Q = np.linalg.eig(t)

    #找到最大特征值对应的特征向量
    res_pos = v.argmax(axis=0)
    w_star2 = Q[:,res_pos]

    #计算 sw^(-1/2)
    v2,Q2 =np.linalg.eig(sw)

    v_half=np.zeros((v2.size,v2.size))
    for i in range(v2.size):
        v_half[i][i]=math.sqrt(v2[i])
    sw_half=Q2 * v_half*(Q2**(-1))

    #最后的结果为 sw^(-1/2)*w_star
    sw_half=sw_half**(-1)
    w_star2=sw_half*w_star2
    res1=0
    for i in range(sz1):
        res1 = res1 + w1[:,i].T*w_star2
    res1/=sz1

    res2=0
    for i in range(sz2):
        res2 = res2 +w2[:,i].T*w_star2
    res2/=sz2
    '''
    #return -(m1+m2)/2, w_star
    return -(res1*sz1+res2*sz2)/(sz1+sz2), w_star


def get_res(w1,w2,X, w0 ,w_star):
    res = X * w_star + w0
    if res >=0:
        print('合格')
        w1=np.append(w1, X, axis=0)
        #print(w1)
    else:

        print('不合格')
        w2=np.append(w2, X, axis=0)
    return w1,w2


def get_line(w, w0):
    # 换两类之间的分界线
    w = np.array(w)
    x = np.linspace(1, 5, 50)
    #print(x)
    y = -w[0,0]*x/w[1,0]-w0/w[1,0]
    y=y.reshape(-1,1)#将行向量转置
    return x, y

def show_fig(w):
     fig = plt.figure()
     ax1 = fig.add_subplot(111)
     ax1.scatter(np.array(w1[:,0]), np.array(w1[:,1]),c='r')
     ax1.scatter(np.array(w2[:,0]), np.array(w2[:,1]),c='y')
     ax1.plot(wx,wy)
     ax1.scatter(np.array(w[0,0]), np.array(w[0,1]),c='b')
     plt.show()


if __name__ == '__main__':

    w1 = np.mat([[2.95, 6.63], [2.53, 7.79], [3.57, 5.65],[3.16,5.47]])
    w2 = np.mat([[2.58, 4.46], [2.16, 6.22], [3.27, 3.52]])

    w0,w_star=fisher(w1, w2)

    fig = plt.figure()
    ax1 = fig.add_subplot(111)#画布布局
    ax1.scatter(np.array(w1[:,0]), np.array(w1[:,1]),c='r')#x,y,cl
    ax1.scatter(np.array(w2[:,0]), np.array(w2[:,1]),c='y')#
    wx,wy=get_line(w_star, w0)
    #plot(wx,wy)
    # print(wy)
    #wx=[wx]
    #显示分类情况
    ax1.plot(wx,wy)
    plt.show()

    #输入样例
    while True:
        n1,n2= map(float,input().split())
        #print(n1,n2)
        w=np.mat([n1,n2])
        show_fig(w)
        w1,w2=get_res(w1,w2,w,np.array(w0),w_star)
6 6
合格
3 3
不合格
