echarts社区 https://www.makeapie.com/expl...
'radar.name': {
textStyle: {
    color: '#5a4b66'
},
formatter: (str) => {
    let obj = _.find(personalityChart, (pc: any) => pc.image === str) || {};
    let percent = obj.percent ? `${Math.round(obj.percent * 100)}%` : '-';
    return `{b|${percent}}  {c|${str}}`;
},
rich: {
    b: {
        color: '#F78A89'
    }
}
},
'**tooltip.formatter': (opts) => {
let indicator = _.get(opts, 'radar.indicator');
return (obj) => {
    let {
        name,
        value
    } = obj.data;
    let contentArr = indicator.map((key, inx) => `${key.name}: ${value[inx]}`);
    contentArr.unshift(obj.marker + name);
    return contentArr.join('
');
};
}
let personalityChart = [{
"celebrity": "",
"celebrity_code": "12345",
"id": 17,
"image": "人品",
"negative": 553,
"percent": 0.6545,
"positive": 4492,
"total": 6018,
"x": "人品",
"name": "王俊凯",
"value": 6018
}, {
"celebrity": "",
"celebrity_code": "12345",
"id": 21,
"image": "品味",
"negative": 157,
"percent": 0.6256,
"positive": 2974,
"total": 4503,
"x": "品味",
"name": "王俊凯",
"value": 4503
}, {
"celebrity": "",
"celebrity_code": "12345",
"id": 22,
"image": "声音",
"negative": 3,
"percent": 0.9225,
"positive": 777,
"total": 839,
"x": "声音",
"name": "王俊凯",
"value": 839
}];
percent来自原始数据personalityChart,str来自echarts渲染后数据
在tooltip格式化处理系列名,画图字段为value,效果图:
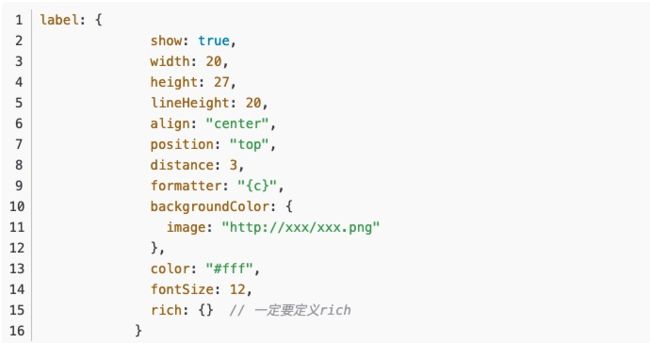
问题二:echarts-series中label的backgroundColor无效
一开始我是像上面那样写的 发现图片出不来,不能用本地的图片
所以我把图片放到服务器上通过http去请求获取,但是发现图片长宽不是我设置的长宽
查看配置文档发现
如果不定义 rich 属性,则不能指定 width 和 height。
https://www.makeapie.com/explore.html
官网上面的某个例子,也可以拿图片当背景,满足
const weatherIcons = {
  Sunny: ROOT_PATH + '/data/asset/img/weather/sunny_128.png',
  Cloudy: ROOT_PATH + '/data/asset/img/weather/cloudy_128.png',
  Showers: ROOT_PATH + '/data/asset/img/weather/showers_128.png'
};
option = {
  color: ['#67F9D8', '#FFE434', '#56A3F1', '#FF917C'],
  title: {
    text: 'Customized Radar Chart'
  },
  legend: {},
  radar: [
    {
      indicator: [
        { text: 'Indicator1' },
        { text: 'Indicator2' },
        { text: 'Indicator3' },
        { text: 'Indicator4' },
        { text: 'Indicator5' }
      ],
      center: ['25%', '50%'],
      radius: 120,
      startAngle: 90,
      splitNumber: 4,
      shape: 'circle',
      name:{
        formatter:['{B1|}{value}'].join('\n'),
        rich: {
          B1: {
            backgroundColor: {
              image: 'https://image.lx1999.cn/images/cf/36/4e/478c4546e1ffa3135caa5ce070618fed53f71b02.jpg'
            },
            height: 40
          }
        },
      },
      // axisName: {
      //   formatter:['{B1|}{value}'].join('\n'),
      //   color: '#428BD4',
      //   rich:{
      //     B1: {
      //       backgroundColor: {
      //           image: weatherIcons.Sunny
      //     },
      //     height: 40
      //     },
      //   }
      // },
      splitArea: {
        areaStyle: {
          color: ['#77EADF', '#26C3BE', '#64AFE9', '#428BD4'],
          shadowColor: 'rgba(0, 0, 0, 0.2)',
          shadowBlur: 10
        }
      },
      axisLine: {
        lineStyle: {
          color: 'rgba(211, 253, 250, 0.8)'
        }
      },
      splitLine: {
        lineStyle: {
          color: 'rgba(211, 253, 250, 0.8)'
        }
      }
    }
  ],
  series: [
    {
      type: 'radar',
      emphasis: {
        lineStyle: {
          width: 4
        }
      },
      data: [
        {
          value: [100, 8, 0.4, -80, 2000],
          name: 'Data A'
        }
      ]
    }
  ]
};