时间序列分析(3)| ARMA模型的拟合
本篇来介绍根据已有的时间序列数据来拟合ARMA模型。需要说明的是不同阶数的ARMA模型可能近似或完全等价,因此模型估计的结果也不是唯一的;筛选标准通常遵守简练性原则。
1 arima()函数
R语言中的stats工具包中的arima()函数可以用来拟合ARMA模型。ARMA(, )等价于ARIMA(, , )。
arima(x, order = c(0L, 0L, 0L),
      seasonal = list(order = c(0L, 0L, 0L), period = NA),
      xreg = NULL, include.mean = TRUE,
      transform.pars = TRUE,
      fixed = NULL, init = NULL,
      method = c("CSS-ML", "ML", "CSS"), n.cond,
      SSinit = c("Gardner1980", "Rossignol2011"),
      optim.method = "BFGS",
      optim.control = list(), kappa = 1e6)
x:已有的时间序列数据;
order:模型的阶数,包含三个元素,分别表示ARIMA模型的三个参数:、、;对于ARMA模型而言,需设置为0;
xreg:可选参数,模型的其他解释变量;向量或矩阵结构,行数与
x参数相同;include.mean:模型中是否包含截距;默认为TRUE;
fixed:可选参数,指定某些参数的取值;向量结构,长度与与参数数目相同(无截距时为,有截距时为),不需要指定的参数对应的位置设置为NA,如果有截距则对应最后一个元素的位置;
init:可选参数,模型参数的初始值;默认都为0,
fixed参数已指定的除外;method:拟合标准;最大似然法(ML)和条件平方和(CSS)最小。
由于在估计ARMA模型时其阶数需要提前指定,即order参数,因此在拟合模型前需要确定模型的阶数,主要依据是样本的自相关系数和偏自相关系数。
2 样本的自相关系数
使用ARMA模型拟合时间序列数据,需要假定数据是平稳序列,这一点可以通过观察数据的走势图是否有明显趋势以及方差是否稳定等进行大致判断。
如下,构造由AR(1):过程生成的数据:
set.seed(123)
epsilon = rnorm(200, sd = 0.1)
y1 = rep(0,200)

for(i in c(2:500)){
  y1[i] = 0.5*y1[i-1] + epsilon[i]
}
y1 = y1[51:200]
plot(y1, type = "l")
上图就是一个平稳序列的走势图。由上篇推文可以知道,该AR(1)过程的自相关系数的理论值应为。
自相关系数的前5个理论值计算如下:
0.5^c(1:5)
## [1] 0.50000 0.25000 0.12500 0.06250 0.03125
若数据可以视为平稳序列,则可以使用样本的均值和方差作为理论均值和方差的估计,自相关系数可以使用下列公式进行估计:
其中,为样本数目。
acf()设置参数plot = F可以得到自相关系数的估计值:
acf(y1, plot = F)[1:5]
## Autocorrelations of series 'y1', by lag
##
##      1      2      3      4      5
##  0.396  0.158  0.104 -0.029  0.029
也可以根据上述公式进行计算:
mu = mean(y1)
sum((y1[2:150] - mu)*(y1[1:149] - mu))/sum((y1 - mu)^2)
sum((y1[3:150] - mu)*(y1[1:148] - mu))/sum((y1 - mu)^2)
sum((y1[4:150] - mu)*(y1[1:147] - mu))/sum((y1 - mu)^2)
sum((y1[5:150] - mu)*(y1[1:146] - mu))/sum((y1 - mu)^2)
sum((y1[6:150] - mu)*(y1[1:145] - mu))/sum((y1 - mu)^2)

## [1] 0.3958401
## [1] 0.1582621
## [1] 0.10402
## [1] -0.02948592
## [1] 0.02875659
可以看出,上述计算结果与
acf()函数得出的结果一致。
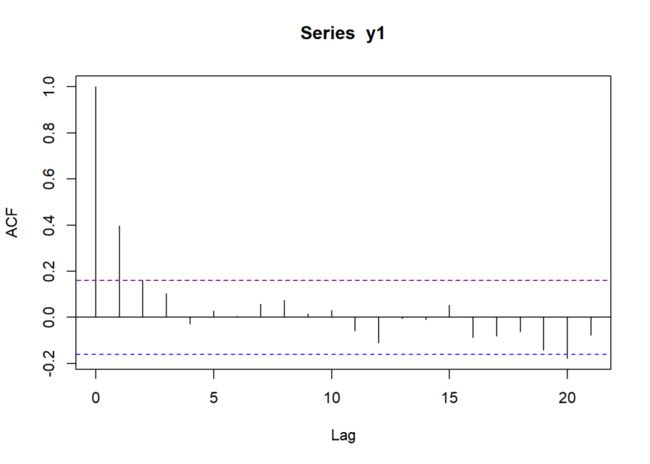
对于大样本而言,自相关系数服从均值为0的正态分布,其方差近似等于()。因此,在95%置信区间下,若自相关系数显著异于0,应有或,也即或。
在上述AR(1)过程中,。
acf(y1)
abline(h = 0.16, col = "red", lty = 3)
可以看出,y = 0.16与上面的蓝色虚线基本重合。
样本的偏自相关函数估计方法这里不再介绍。在实际操作过程中,可以直接使用acf()和pacf()函数得到ACF和PACF的图象,并以此来判断模型的可能阶数。
3 模型评价
3.1 AIC与BIC
评价ARMA模型一般使用赤池信息准则(AIC)或贝叶斯信息准则(BIC)。
信息准则的通式为:
对于AIC而言,;
对于BIC而言,。
其中
npar为需要估计的参数个数,N为样本个数。
上述信息准则可以分别使用AIC()和BIC()函数进行计算,数值越小表示模型拟合效果越好。
3.2 Q统计量
一个合适的时间序列模型其残差应为白噪声,也就是说残差序列的自相关系数应始终为0。Q统计量可以用来判断一组自相关系数是否显著异于0,其零假设是、、...、都等于0;在零假设成立的前提下,Q统计量服从自由度为的卡方分布()。
Q统计量有如下两种形式:
Box-Pierce (1970):;
Ljung-Box (1978):。
在R中,可以使用stats工具包中Box.text()函数计算上述两种Q统计量
Box.test(x, lag = 1,
         type = c("Box-Pierce", "Ljung-Box"),
         fitdf = 0)
4 实例
使用生成示例数据:
set.seed(2021)
epsilon = rnorm(200)
y2 = rep(0, 200)
for(i in c(4:200)){
  y2[i] = 0.5*y2[i-1] + epsilon[i] + 0.4*epsilon[i-1]
}
y2 = y2[51:200]
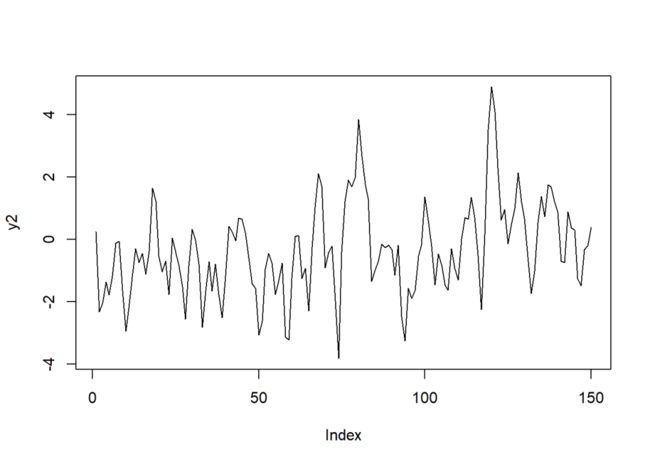
plot(y2, type = "l")
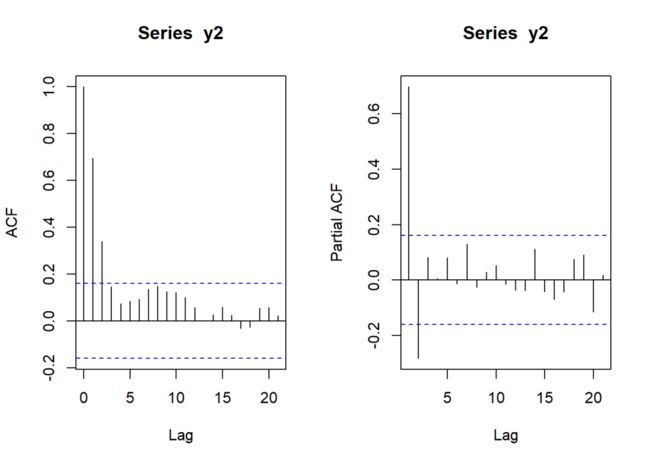
绘制ACF和PACF图象:
par(mfrow = c(1,2))
acf(y2)
pacf(y2)
ARMA(1,1)模型的图象特征是:ACF和PACF均从处开始逐渐衰减。如果事先已知模型的阶数,再去使用图象进行印证,那么二者当然是吻合的。但是,如果事先不知道模型阶数,将上图中的ACF看作是截尾分布、PACF是拖尾分布也无不可,那么模型的阶数就应当是MA(2)或MA(3);同理,如果认为ACF是拖尾分布、PACF是截尾分布,那么模型的阶数就很有可能是AR(2)。
下面依次分析上述假设。
假设数据的真实过程是纯MA过程
(model.11 <- arima(y2[3:150], order = c(0,0,2),
                  include.mean = F,
                  method = "ML"))
## Call:
## arima(x = y2[3:150], order = c(0, 0, 2), include.mean = F, method = "ML")
##
## Coefficients:
##          ma1     ma2
##       0.8761  0.3280
## s.e.  0.0733  0.0791
##
## sigma^2 estimated as 1.076:  log likelihood = -215.82,  aic = 437.65
(model.12 <- arima(y2[2:150], order = c(0,0,3),
                  include.mean = F,
                  method = "ML"))
## Call:
## arima(x = y2[2:150], order = c(0, 0, 3), include.mean = F, method = "ML")
##
## Coefficients:
##          ma1     ma2     ma3
##       0.9670  0.5175  0.2157
## s.e.  0.0815  0.1042  0.0727
##
## sigma^2 estimated as 1.017:  log likelihood = -213.16,  aic = 434.32
(model.13 <- arima(y2, order = c(0,0,4),
                  include.mean = F,
                  method = "ML"))
## Call:
## arima(x = y2, order = c(0, 0, 4), include.mean = F, method = "ML")
##
## Coefficients:
##          ma1     ma2     ma3     ma4
##       0.9575  0.4963  0.2055  0.0004
## s.e.  0.0821  0.1065  0.1094  0.0849
##
## sigma^2 estimated as 1.031:  log likelihood = -215.61,  aic = 441.21
因为模型中的滞后变量会导致样本损失,为了保证所有模型使用的样本数一致,阶数低的模型应当剔除部分样本;
从系数的显著性上看,MA(3)过程的3个系数都是显著的,而MA(4)过程的系数是不显著的,说明项是多余的,即MA(3)优于MA(4);
从AIC的角度看,MA(4) > MA(2) > MA(3);
综合来看,如果假设数据的真实过程是纯MA过程,那么最优的模型形式应当是MA(3)过程。
假设数据的真实过程是纯AR过程
(model.21 <- arima(y2[2:150], order = c(2,0,0),
                  include.mean = F,
                  method = "ML"))
## Call:
## arima(x = y2[2:150], order = c(2, 0, 0), include.mean = F, method = "ML")
##
## Coefficients:
##          ar1      ar2
##       0.9236  -0.2830
## s.e.  0.0784   0.0787
##
## sigma^2 estimated as 1.033:  log likelihood = -214.31,  aic = 434.61
(model.22 <- arima(y2, order = c(3,0,0),
                  include.mean = F,
                  method = "ML"))
## Call:
## arima(x = y2, order = c(3, 0, 0), include.mean = F, method = "ML")
##
## Coefficients:
##          ar1      ar2     ar3
##       0.9435  -0.3815  0.1027
## s.e.  0.0818   0.1092  0.0820
##
## sigma^2 estimated as 1.037:  log likelihood = -216.05,  aic = 440.1
同理,从系数显著性和AIC的角度看,AR(2)过程均优于AR(3)过程。
假设数据的真实过程是ARMA(, )
(model.31 <- arima(y2[2:150], order = c(1,0,1),
                  include.mean = F,
                  method = "ML"))
## Call:
## arima(x = y2[2:150], order = c(1, 0, 1), include.mean = F, method = "ML")
##
## Coefficients:
##          ar1     ma1
##       0.5379  0.4169
## s.e.  0.0902  0.0998
##
## sigma^2 estimated as 1.022:  log likelihood = -213.49,  aic = 432.98
(model.32 <- arima(y2, order = c(2,0,1),
                  include.mean = F,
                  method = "ML"))
## Call:
## arima(x = y2, order = c(2, 0, 1), include.mean = F, method = "ML")
##
## Coefficients:
##          ar1      ar2     ma1
##       0.5375  -0.0173  0.4101
## s.e.  0.3406   0.2673  0.3317
##
## sigma^2 estimated as 1.036:  log likelihood = -215.98,  aic = 439.96
(model.33 <- arima(y2, order = c(1,0,2),
                  include.mean = F,
                  method = "ML"))
## Call:
## arima(x = y2, order = c(1, 0, 2), include.mean = F, method = "ML")
##
## Coefficients:
##          ar1     ma1     ma2
##       0.5096  0.4377  0.0080
## s.e.  0.1700  0.1834  0.1671
##
## sigma^2 estimated as 1.036:  log likelihood = -215.98,  aic = 439.96
显然,ARMA(1,1)过程是上述3个模型中最优的。
现在,得到三个备选模型:MA(3)、AR(2)、ARMA(1,1):
(model.1 <- arima(y2, order = c(0,0,3),
                  include.mean = F,
                  method = "ML"))
## Call:
## arima(x = y2, order = c(0, 0, 3), include.mean = F, method = "ML")
##
## Coefficients:
##          ma1     ma2     ma3
##       0.9575  0.4962  0.2051
## s.e.  0.0821  0.1044  0.0728
##
## sigma^2 estimated as 1.031:  log likelihood = -215.61,  aic = 439.21
(model.2 <- arima(y2[2:150], order = c(2,0,0),
                  include.mean = F,
                  method = "ML"))
## Call:
## arima(x = y2[2:150], order = c(2, 0, 0), include.mean = F, method = "ML")
##
## Coefficients:
##          ar1      ar2
##       0.9236  -0.2830
## s.e.  0.0784   0.0787
##
## sigma^2 estimated as 1.033:  log likelihood = -214.31,  aic = 434.61
(model.3 <- arima(y2[3:150], order = c(1,0,1),
                  include.mean = F,
                  method = "ML"))
## Call:
## arima(x = y2[3:150], order = c(1, 0, 1), include.mean = F, method = "ML")
##
## Coefficients:
##          ar1     ma1
##       0.5334  0.4147
## s.e.  0.0908  0.1006
##
## sigma^2 estimated as 1.025:  log likelihood = -212.31,  aic = 430.61
上述三个模型中,“最差”的是MA(3)过程:除了因为它的AIC略高于其他两个模型外,最主要的还是因为同时它的形式也是最“复杂”的。对于时间序列模型来讲,在一定程度上宁可舍弃拟合效果也倾向于使模型形式更加“简练”。
ARMA(1,1)和AR(2)过程的简练性差不多,下面检验两种模型的残差:
e.2 <- residuals(model.2)
Box.test(e.2, 8, type = "Ljung-Box")
##  Box-Ljung test
##
## data:  e.2
## X-squared = 4.6561, df = 8, p-value = 0.7936
Box.test(e.2, 24, type = "Ljung-Box")
##  Box-Ljung test
##
## data:  e.2
## X-squared = 24.976, df = 24, p-value = 0.4071

e.3 <- residuals(model.3)
Box.test(e.3, 8, type = "Ljung-Box")
##  Box-Ljung test
##
## data:  e.3
## X-squared = 3.509, df = 8, p-value = 0.8985
Box.test(e.3, 24, type = "Ljung-Box")
##  Box-Ljung test
##
## data:  e.3
## X-squared = 19.398, df = 24, p-value = 0.7305
从检验结果看,两个模型的残差都可以看作白噪音,因此它们都是可以接受的。最后分别使用完整样本估计两个模型:
(arima(y2, order = c(2,0,0),
       include.mean = F,
       method = "ML"))
## Coefficients:
##          ar1      ar2
##       0.9141  -0.2868
## s.e.  0.0788   0.0792
(arima(y2, order = c(1,0,1),
       include.mean = F,
       method = "ML"))
## Coefficients:
##          ar1     ma1
##       0.5164  0.4304
## s.e.  0.0916  0.1012
AR(2):
ARMA(1,1):
另外,可以看出ARMA(1,1)的估计结果与真实的数据生成过程是很接近的。