OpenCV_Python官方文档10——图像几何变换
OpenCV-Python Tutorials
https://opencv-python-tutroals.readthedocs.io/en/latest/py_tutorials/py_tutorials.html
图像的几何变换主要包括:缩放、平移、旋转、仿射、透视等等。图像变换是建立在矩阵运算基础上的,通过矩阵运算可以很快的找到对应关系。
图像缩放
主要函数
cv2.resize()具体内容点击此处查看
注意:cv2.resize函数的dst和dsize参数输入是 (宽度,高度),与img.shape相反。
对于img.shape的输出参数以及对应坐标请点击这里查看
import cv2
import numpy as np
import matplotlib.pyplot as plt
import os
os.chdir('C:/Users/lenovo/Pictures/')

dolphin = cv2.imread('dolphin.jpg')

#dst = cv2.resize(dolphin,None,fx=2,fy=2,interpolation=cv2.INTER_CUBIC)
#or
rows,cols = dolphin.shape[:2]
dst = cv2.resize(dolphin,(2*cols,2*rows),interpolation=cv2.INTER_CUBIC)#放大一倍
dst1 = cv2.resize(dolphin,None,fx=0.5,fy=0.5,interpolation=cv2.INTER_AREA)#缩小一倍

imgs = [dolphin,dst,dst1]
titles = ['dolphin','dst','dst1']
for i in range(len(imgs)):
    plt.subplot(1,len(imgs),i+1)
    imgs[i]=cv2.cvtColor(imgs[i],cv2.COLOR_BGR2RGB)
    plt.imshow(imgs[i],'gray')
    plt.title(titles[i])
    plt.axis('off')
plt.show()
输出结果
通过坐标轴可以看到图像的放大和缩小
主要函数
dst = cv2.warpAffine(src, M, dsize[, dst[, flags[, borderMode[, borderValue]]]])
-
src - 原输入图像
-
M - 仿射变换矩阵 ,一般反映平移或旋转的关系,为InputArray类型的2×3的变换矩阵
-
dsize - 输出变换图像的大小(这个大小如果不和原始图像大小相同,那么函数会自动通过插值来调整像素间的关系)
-
flags - 插值方法的组合(int 类型!)
-
borderMode - 边界像素模式(int 类型!)
-
borderValue - (重点!)边界填充值; 默认为0,即为黑色
-
flags:插值方法,共5种
- INTER_LINEAR - 双线性插值(默认)
- INTER_NEAREST - 最近邻插值
- INTER_AREA - 基于像素局部的重采样插值
- INTER_CUBIC - 三次样条插值
- INTER_LANCZOS4 - 基于8x8像素邻域的Lanczos(兰索斯)插值
注意:也就是说cv2.warpAffine()函数的dst和dsize参数输入是 (宽度,高度),与img.shape相反。
对于img.shape的输出参数以及对应坐标请点击这里查看
图像平移
如果想要沿(x,y)方向移动,移动的距离为(tx,ty)即沿着x轴平移距离tx,沿着y轴平移距离ty,可以以下面方式构建平移矩阵。通过numpy来产生这个矩阵M。
M = [ 1 0 t x 0 1 t y ] M=\begin{bmatrix} 1 & 0 & tx\\ 0 & 1 & ty \end{bmatrix} M=[1001txty]
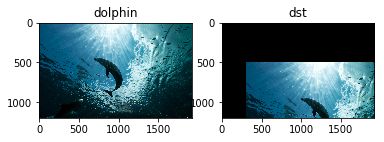
将图像沿x轴平移300像素,沿y轴平移500像素
import cv2
import numpy as np
import matplotlib.pyplot as plt
import os
os.chdir('C:/Users/lenovo/Pictures/')

img = cv2.imread('dolphin.jpg')

#平移
M = np.float32([[1,0,300],[0,1,500]])#仿射矩阵
rows,cols = img.shape[:2]
dst = cv2.warpAffine(img,M,(cols,rows))

imgs = [img,dst]
titles = ['dolphin','dst']
for i in range(len(imgs)):
    plt.subplot(1,len(imgs),i+1)
    imgs[i]=cv2.cvtColor(imgs[i],cv2.COLOR_BGR2RGB)
    plt.imshow(imgs[i],'gray')
    plt.title(titles[i])
    plt.axis('on')
plt.show()
图像旋转
通常意义上,一个图像旋转角度为 θ \theta θ图像的旋转矩阵为
M = [ c o s θ − s i n θ s i n θ c o s θ ] M=\begin{bmatrix} cos\theta & -sin\theta\\ sin\theta & cos\theta \end{bmatrix} M=[cosθsinθ−sinθcosθ]
但是通常这个矩阵M是以原点为旋转中心,如果想要图像在任何位置都可以旋转,该矩阵应为
M = [ α − β ( 1 − α ) c e n t e r x − β c e n t e r y − β α β c e n t e r x + ( 1 − α ) c e n t e r y ] M=\begin{bmatrix} \alpha&-\beta&(1-\alpha)center_x-\beta center_y\\-\beta&\alpha&\beta center_x+(1-\alpha)center_y\end{bmatrix} M=[α−β−βα(1−α)centerx−βcenteryβcenterx+(1−α)centery]
其中
α = s c a l e ⋅ c o s θ β = s c a l e ⋅ s i n θ \alpha=scale\cdot cos\theta\\\beta=scale\cdot sin\theta α=scale⋅cosθβ=scale⋅sinθ
为构建旋转矩阵,OpenCV提供了一个函数M=cv2.getRotationMatrix2D(rotate_center, degree, scale)
- rotate_center:二维数组,表示旋转中心的坐标
- degree:逆时针旋转角度
- scale:缩放比例
将图像以图像中心为旋转点逆时针旋转45°
import cv2
import numpy as np
import matplotlib.pyplot as plt
import os
os.chdir('C:/Users/lenovo/Pictures/')

img = cv2.imread('dolphin.jpg')

#旋转
M=cv2.getRotationMatrix2D((cols/2,rows/2),45,1)
rows,cols = img.shape[:2]
dst = cv2.warpAffine(img,M,(cols,rows))

imgs = [img,dst]
titles = ['dolphin','dst']
for i in range(len(imgs)):
    plt.subplot(1,len(imgs),i+1)
    imgs[i]=cv2.cvtColor(imgs[i],cv2.COLOR_BGR2RGB)
    plt.imshow(imgs[i],'gray')
    plt.title(titles[i])
    plt.axis('on')
plt.show()
输出图像:
图像仿射变换
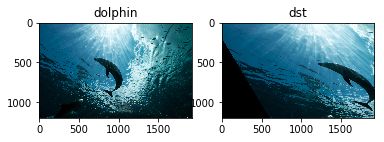
图像的旋转加上拉伸就是图像仿射变换,原图中所有平行线在输出图像中同样平行。仿射变换是透视变换的特殊形式。由于仿射变换比较复杂,一般直接找很难找到这个矩阵,OpenCV中提供了getAffineTransform()函数获得透视变换矩阵M.
M = cv2.getAffineTransform(pts1, pts2)
- pts1,pts2分别为变换前点的位置以及变换后点的位置
import cv2
import numpy as np
import matplotlib.pyplot as plt
import os
os.chdir('C:/Users/lenovo/Pictures/')

img = cv2.imread('dolphin.jpg')

#仿射变换
pts1 = np.float32([[50,80],[200,50],[50,200]])
pts2 = np.float32([[10,100],[200,50],[100,250]])
M = cv2.getAffineTransform(pts1,pts2)

rows,cols = img.shape[:2]
dst = cv2.warpAffine(img,M,(cols,rows))

imgs = [img,dst]
titles = ['dolphin','dst']
for i in range(len(imgs)):
    plt.subplot(1,len(imgs),i+1)
    imgs[i]=cv2.cvtColor(imgs[i],cv2.COLOR_BGR2RGB)
    plt.imshow(imgs[i],'gray')
    plt.title(titles[i])
    plt.axis('on')
plt.show()
输出图像:
图像的透视变换
仿射变换保证物体形状的“平直性”和“平行性”。透视变换不能保证物体形状的“平行性”。仿射变换是透视变换的特殊形式。需要在原输入图像上找到4个点,以及他们在输出图像上对应的位置,这四个点中任意三个都不能共线。
主要函数
M = cv2.getPerspectiveTransform(pts1,pts2),其中pts需要变换前后的4个点对应位置。M为3*3的矩阵dst = cv2.warpPerspective(src, M, dsize[, dst[, flags[, borderMode[, borderValue]]]])与cv2.warpAffine()用法相似
import cv2
import numpy as np
import matplotlib.pyplot as plt
import os
os.chdir('C:/Users/lenovo/Pictures/')

img = cv2.imread('dolphin.jpg')

#透视变换
pts1 = np.float32([[56,65],[368,52],[28,387],[389,390]])
pts2 = np.float32([[0,0],[300,0],[0,300],[300,300]])
M = cv2.getPerspectiveTransform(pts1,pts2)

rows,cols = img.shape[:2]
dst = cv2.warpPerspective(img,M,(cols,rows))#默认黑边
dst1 = cv2.warpPerspective(img,M,(cols,rows),borderValue=(255,255,255))#白边

imgs = [img,dst,dst1]
titles = ['dolphin','dst','dst1']
for i in range(len(imgs)):
    plt.subplot(1,len(imgs),i+1)
    imgs[i]=cv2.cvtColor(imgs[i],cv2.COLOR_BGR2RGB)
    plt.imshow(imgs[i],'gray')
    plt.title(titles[i])
    plt.axis('on')
plt.show()
通常进行变换时,在只设置前三个参数的情况下,会出现黑边现象,会对后续的处理往往造成很大的困扰,第六个参数可以选择填充的颜色,默认为黑色。
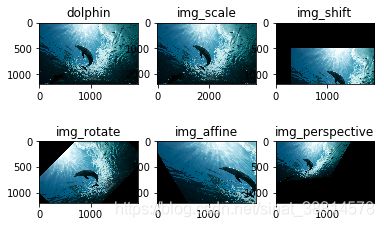
图像几何变换大集合
import cv2
import numpy as np
import matplotlib.pyplot as plt
import os
os.chdir('C:/Users/lenovo/Pictures/')

img = cv2.imread('dolphin.jpg')
rows,cols = img.shape[:2]

# 缩放Scaling:
img_scale = cv2.resize(img,(cols*2,rows*2))

# Translation:

#1.平移shift:

M_shift = np.float32([[1,0,300],[0,1,500]])
img_shift = cv2.warpAffine(img,M_shift,(cols,rows))

#2.旋转rotate

M_rotate = cv2.getRotationMatrix2D((cols/2,rows/2),45,1)
img_rotate = cv2.warpAffine(img,M_rotate,(cols,rows))

#3.仿射变换affine

pts1 = np.float32([[50,80],[200,50],[50,200]])
pts2 = np.float32([[10,100],[200,50],[100,250]])
M_affine = cv2.getAffineTransform(pts1,pts2)
img_affine = cv2.warpAffine(img,M_affine,(cols,rows))

#4.透视变换perspective

pts3 = np.float32([[56,65],[368,52],[28,387],[389,390]])
pts4 = np.float32([[0,0],[300,0],[0,300],[300,300]])
M_perspective = cv2.getPerspectiveTransform(pts3,pts4)
img_perspective = cv2.warpPerspective(img,M_perspective,(cols,rows))#默认黑边
#img_perspective1 = cv2.warpPerspective(img,M_perspective,(cols,rows),borderValue=(255,255,255))#白边

imgs = [img,img_scale,img_shift,img_rotate,img_affine,img_perspective]
titles = ['dolphin','img_scale','img_shift','img_rotate','img_affine','img_perspective']
for i in range(len(imgs)):
    plt.subplot(2,3,i+1)
    imgs[i]=cv2.cvtColor(imgs[i],cv2.COLOR_BGR2RGB)
    plt.imshow(imgs[i],'gray')
    plt.title(titles[i])
    plt.axis('on')
plt.show()
输出结果:


