生存分析 R语言(二)——Cox PHM(1)
题目
使用R自带数据集veteran进行操作,是被诊断有肺癌的老兵生存数据。
载入数据集
library(survival)
library(survminer)
data()#列出已载入的包的所有数据集
data(package=.packages(all.available=TRUE))#列出已安装的包的所有数据集
可以从弹出的窗口中看到veteran数据集已经在里面
注:可以使用?veteran, 查看数据集解释(包括变量解释)
str(veteran)#显示veteran的数据基本信息
'data.frame':	137 obs. of  8 variables:
 $ trt     : num  1 1 1 1 1 1 1 1 1 1 ...
 $ celltype: Factor w/ 4 levels "squamous","smallcell",..: 1 1 1 1 1 1 1 1 1 1 ...
 $ time    : num  72 411 228 126 118 10 82 110 314 100 ...
 $ status  : num  1 1 1 1 1 1 1 1 1 0 ...
 $ karno   : num  60 70 60 60 70 20 40 80 50 70 ...
 $ diagtime: num  7 5 3 9 11 5 10 29 18 6 ...
 $ age     : num  69 64 38 63 65 49 69 68 43 70 ...
 $ prior   : num  0 10 0 10 10 0 10 0 0 0 ...
trt是treatment type;
cell type是癌细胞类型,包含squamous,adeno,large,small;
time是survival或censoring time(days);
status是indicator(1指death,0指censoring);
karno为performance status(scale of 0-100 which is karnofsky performance score);
diagtime为disease duration(months);
age为病人年龄;
prior指是否给予了prior therapy。
Cox PHM实现
拟合Cox PHM
treatment为唯一协变量(binary)
phm.trt=coxph(Surv(time,status)~trt)#拟合Cox PHM
d.phm.trt=coxph.detail(phm.trt)#得到模型细节
summary(phm.trt)#显示概要
Call:
coxph(formula = Surv(time, status) ~ trt)

  n= 137, number of events= 128

       coef exp(coef) se(coef)     z Pr(>|z|)
trt 0.01774   1.01790  0.18066 0.098    0.922

    exp(coef) exp(-coef) lower .95 upper .95
trt     1.018     0.9824    0.7144      1.45

Concordance= 0.525  (se = 0.026 )
Likelihood ratio test= 0.01  on 1 df,   p=0.9
Wald test            = 0.01  on 1 df,   p=0.9
Score (logrank) test = 0.01  on 1 df,   p=0.9
得到拟合模型为:
h ( t , x ) = h 0 ( t , α ) e x p ( 0.01774 x ) h(t,x)=h_0(t,\alpha)exp(0.01774x) h(t,x)=h0(t,α)exp(0.01774x)
注:continuous变量(如age)同理。
celltype为唯一协变量(categorical)
此处celltype在R中为因子型变量,也是分类变量,一共四个种类,拟合所得Cox PHM将仅包含其中三个变量,因为四个变量之和为1(可以理解为自由度是3)。得到如下结果:
Call:
coxph(formula = Surv(time, status) ~ celltype)

  n= 137, number of events= 128

                    coef exp(coef) se(coef)     z Pr(>|z|)
celltypesmallcell 1.0013    2.7217   0.2535 3.950 7.83e-05 ***
celltypeadeno     1.1477    3.1510   0.2929 3.919 8.90e-05 ***
celltypelarge     0.2301    1.2588   0.2773 0.830    0.407
---
Signif. codes:  0 ‘***’ 0.001 ‘**’ 0.01 ‘*’ 0.05 ‘.’ 0.1 ‘ ’ 1

                  exp(coef) exp(-coef) lower .95 upper .95
celltypesmallcell     2.722     0.3674     1.656     4.473
celltypeadeno         3.151     0.3174     1.775     5.594
celltypelarge         1.259     0.7944     0.731     2.168

Concordance= 0.608  (se = 0.028 )
Likelihood ratio test= 24.85  on 3 df,   p=2e-05
Wald test            = 24.09  on 3 df,   p=2e-05
Score (logrank) test = 25.51  on 3 df,   p=1e-05
h ( t , x ) = h 0 ( t , α ) e x p ( 1.0013 x 1 + 1.1477 x 2 + 0.2301 x 3 ) h(t,x)=h_0(t,\alpha)exp(1.0013x_1+1.1477x_2+0.2301x_3) h(t,x)=h0(t,α)exp(1.0013x1+1.1477x2+0.2301x3)
Tips(删除环境中数据)
有时候模型建立的很多,因为需要看哪些变量是显著有效的,所以环境中的数据就很多很杂,这时候可以删除一些不必要的数据对象。
rm(phm.age)#删除phm.age
rm(list=ls())#删除所有对象
利用PHM画图
此处以celltype为covariate拟合得到PHM后画图
factor型的变量无法计算均值,三种方法处理
方案一
手动计算均值,然后填入
d.phm.celltype=coxph.detail(phm.celltype)
times=c(0,d.phm.celltype$time)
h0=c(0,d.phm.celltype$hazard)
#hazard baseline function
S0=exp(-cumsum(h0))
#survival baseline function
beta=phm.celltype$coefficients
#系数
coxph.detail返回the estimate for an average individual(即协变量是基于样本的平均估计出来的)而非真正的baseline hazard,故要把协变量的均值减去。
meanx=c(0.197080292,0.197080292,0.350364964) #协变量均值
x=c(0)-meanx
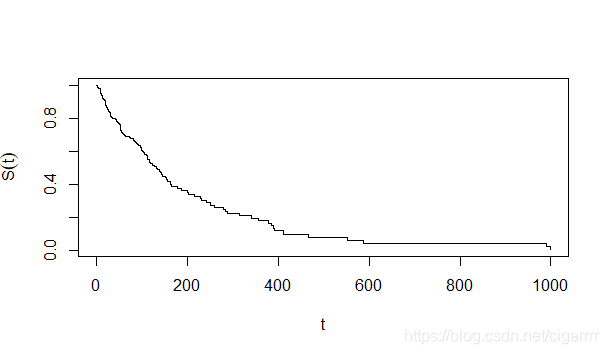
Sx=S0^exp(t(beta)%*%x) #生存函数
xlb='t'; ylb=expression(hat(S)(t))
plot(times,Sx,type='s',xlab=xlb,ylab=ylb)
方案二
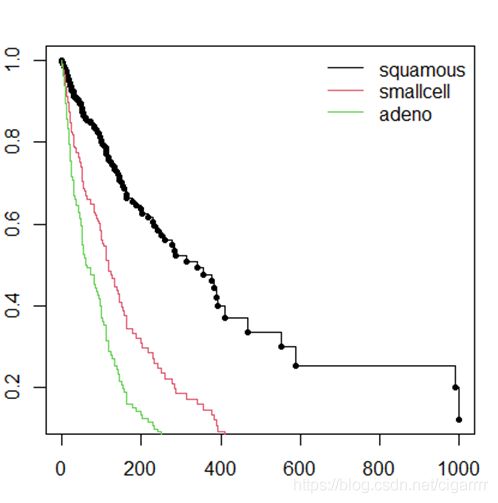
也可以选择利用as.numeric将covariate变成continuous type,但是由于系统自带数据集中的变量是无法更改的,所以要将转化后的数据赋到一个新变量身上,对新变量建立cox phm,如:
cell=as.numeric(celltype)
meanx=mean(cell)
x1=1-meanx
x2=2-meanx
x3=3-meanx
#分别对应三类的取值1,2,3,之所以只有三个是因为若建模时四个变量都用会导致多重共线性
Sx1=S0^exp(t(beta[1])%*%x1)
Sx2=S0^exp(t(beta[2])%*%x2)
Sx3=S0^exp(t(beta[3])%*%x3)
#三个生存函数,t()是转置函数
par(mar=c(3,2,2,1))
#调整图片边距(若有报错边距过大则要调整,否则不需要)
plot(times,Sx1,pch=20)
#Sx1的散点图
lines(times,Sx1,col=1,type='s')
lines(times,Sx2,col=2,type='s')
lines(times,Sx3,col=3,type='s')
#lines函数加上其它几个函数的线图
legend("topright",1,c('squamous','smallcell','adeno'),lty=1,col=c(1,2,3),bty='n')
#调整图例,线条,颜色等
方案三
将因子变量转化为哑变量
利用class.ind函数
library("nnet")#class.ind()函数需要包
dummycell=class.ind(celltype)
#注意class.ind得到的是四个哑变量,只能使用其中三个,否则会有共线性
...(步骤一样省略)
meanx=colMeans(dummycell)#对每列求均值
meanx=meanx[1:length(meanx)-1]#去掉最后一个均值
...(省略)

