【Matplotlib常用知识速查】
目录
- 1. 基本用法
-
- 1.1 基本框架
- 1.2 plt.plot()参数
- 1.3 图表标注
- 1.4 多图:plt.subplots()
- 2 各类常用图
-
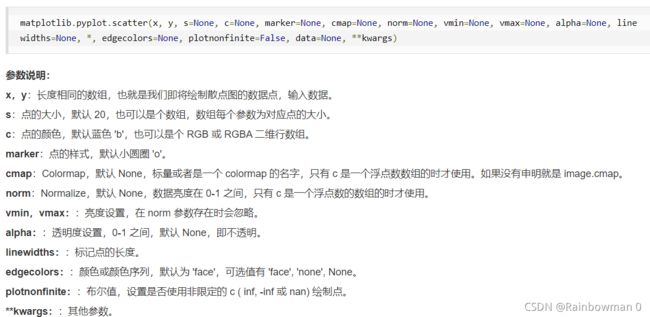
- 2.1 散点图:plt.scatter()
- 2.2 柱形图:plt.bar()和plt.barh()
- 2.3 饼图:plt.pie()
- 2.4 直方图:plt.hist(x, bins)
- 3 更多详细信息:
1. 基本用法
1.1 基本框架
import numpy as np
import matplotlib.pyplot as plt

x = np.arange(0,10,0.1)
y = np.sin(x)

plt.plot(x, y)
plt.show()
1.2 plt.plot()参数
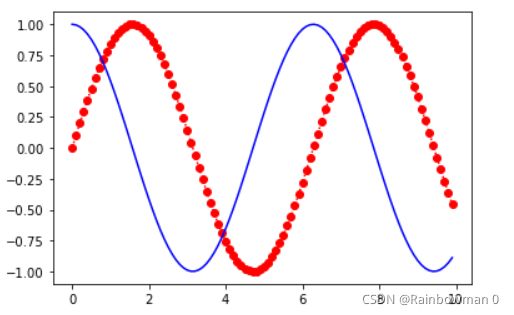
x = np.arange(0,10,0.1)
y = np.sin(x)
z = np.cos(x)

plt.plot(x, y, 'o:r')
plt.plot(x, z, '-b')

plt.show()
1.3 图表标注
(1)X,Y轴:plt.xlabel() plt.ylabel()
(2)标题:plt.title
(3)图例:plt.legend()
(4)网格:plt.grid()
x = np.arange(0,10,0.1)
y = np.sin(x)
z = np.cos(x)

plt.plot(x, y, 'o:r', label='sin(x)') # 使用图例plt.legend()必须先指定label参数
plt.plot(x, z, '-b', label='cos(x)')  # 使用图例plt.legend()必须先指定label参数
plt.grid() # 开启网格

plt.title('This is title')
plt.xlabel('X Label')
plt.ylabel('Y Label')

plt.show()
1.4 多图:plt.subplots()
详细参数说明:
# 用法如下:
x = np.arange(0,10,0.1)
y = np.sin(x)
z = np.cos(x)

# fig是总画布, axs是每个画布
fig, axs = plt.subplots(2, 2, figsize=(10,10)) # figsize指定画布fig的大小
fig.suptitle('Suptitle') # fig.suptitle()指定总标题
axs[0, 0].plot(x, y, 'o:r', label='sin(x)')
axs[0, 0].set_title('title1') # ax.set_title()指定每个画布的小标题
axs[0, 0].legend() # 显示图例
axs[1, 1].scatter(x, z, label='cos(x)')

plt.subplots_adjust(wspace=0.2, hspace=0.2)  # plt.subplots_adjust()可以调整每个ax之间的间距
plt.subplots_adjust(left=None, bottom=None, right=None, top=None,
wspace=None, hspace=None)
left = 0.125 # the left side of the subplots of the figure
right = 0.9 # the right side of the subplots of the figure
bottom = 0.1 # the bottom of the subplots of the figure
top = 0.9 # the top of the subplots of the figure
wspace = 0.2 # the amount of width reserved for blank space between subplots, expressed as a fraction of the average axis width
hspace = 0.2 # the amount of height reserved for white space between subplots, expressed as a fraction of the average axis height
在多图中,每个画布ax的图表标注前面都要加个set_,如:
plt.title() -----> ax.set_title()
plt.xlabel() -----> ax.set_xlabel()
2 各类常用图
2.1 散点图:plt.scatter()
# 散点图
x = np.arange(0,10,0.1)
y = np.sin(x)

plt.scatter(x, y)
plt.xlabel('X')
plt.ylabel('Y')
plt.title('Scatter')

plt.show()
2.2 柱形图:plt.bar()和plt.barh()
fig, axs = plt.subplots(2,2,figsize=(8,8))

np.random.seed(100)
x = np.array(['A','B','C','D','E'])
y = np.random.randint(0,100,size=5)

axs[0,0].bar(x,y)
axs[0,0].set_xlabel('X label')
axs[0,0].set_ylabel('Y label')
axs[0,0].set_title('Bar Graph Width=0.8')

axs[0,1].bar(x,y, width=0.5)
axs[0,1].set_xlabel('X label')
axs[0,1].set_ylabel('Y label')
axs[0,1].set_title('Bar Graph Width=0.5')

axs[1,0].barh(x,y,height=0.8)
axs[1,0].set_xlabel('X label')
axs[1,0].set_ylabel('Y label')
axs[1,0].set_title('Barh Graph height=0.8')

axs[1,1].barh(x,y, height=0.5)
axs[1,1].set_xlabel('X label')
axs[1,1].set_ylabel('Y label')
axs[1,1].set_title('Barh Graph height=0.5')

plt.subplots_adjust(wspace=0.4,hspace=0.3)
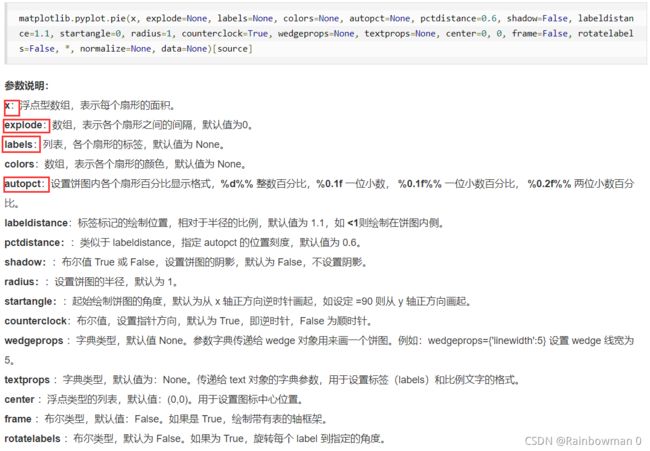
2.3 饼图:plt.pie()
np.random.seed(100)
x= np.random.randint(0,100,5)

plt.pie(x,
       labels=['A','B','C','D','E'],
       explode=[0.2, 0, 0, 0.1, 0],
       autopct='%.2f%%')

plt.title('Pie Graph')

plt.show()
2.4 直方图:plt.hist(x, bins)
np.random.seed(100)
x = np.random.normal(0, 1, size=2000)  # 生成2000个标准正态分布

fig, axs = plt.subplots(1,2,figsize=(10,6))
axs[0].hist(x, bins=50) # bins的意思是生成多少个竖条
axs[0].set_title('bins=50')

axs[1].hist(x, bins=10) # bins的意思是生成多少个竖条
axs[1].set_title('bins=10')
3 更多详细信息:
Matplotlib更多详细信息
Matplotlib官网


