基于人口普查数据的收入预测模型构建及比较分析(Python数据分析分类器模型实践)
基于人口普查数据的收入预测模型构建及比较分析
这篇文章是上学期数据分析课程的作业,本来想等成绩出来后再分享出来,但是因为疫情原因成绩迟迟没有上传,所以这里就先分享出来,如果有分析的不对的地方,欢迎一起分析讨论,共同学习
摘要
收入是反映人民生活水平和国家经济发展状况的重要指标,改善收入水平,提高生活质量是各国政府和人民共同的奋斗目标。探索收入的影响因素,不仅对国家具有重要意义,对个人提升自我,企业识别目标消费群体也具有重要的参考价值。为了研究年龄、受教育程度、职业等诸多因素对个体收入的影响,本文以UCI Machine Learning Repository网站提供的人口普查数据Adult Data Set作为数据样本,遵循CRISP-DM的数据挖掘流程,对数据中可能存在的规律进行探索和分析,构建决策树、Logistic回归、K近邻、线性支持向量机、随机森林、AdaBoost等十个分类模型探究各项指标对个体收入的影响和对个体收入进行预测,并通过多个模型评价指标,对不同的分类模型的分类效果进行比较和评价。
关键词:数据分析;分类算法;预测;模型评价;数据可视化;
一、业务理解
对于个人来说,收入可以一定程度上反映个体的生活水平和消费能力,影响个人对于商品、服务需求的种类和数量,影响个人的社会地位、健康状况和幸福水平。
对于企业而言,不同收入人群的购买力和产品偏好不同,对价格的敏感程度也不同,识别不同收入人群,有助于帮助企业有针对性地设计、生产、推广产品和提供差异化的服务,从而提高产品和服务的销售量,节约销售费用,降低企业生产和运营成本,更好地塑造企业形象,为企业带来更大的市场份额和更多的利润。
对于国家而言,个人收入水平能够直接反应人民的生活水平和国家的经济发展状况,个人收入的提高能够显著提高人民的购买力,提高国民生产总值,促进各行各业的平稳健康发展。分析人民收入的影响因素,探索不同指标对收入的影响情况,有助于国家对提高人民生活水平、改善社会福利、提高国民素质制定更加有效和更加有针对性的措施。
国内外的大量研究已充分证明,受教育程度和工作经验是影响一个人工作收入的重要因素。但实际上,我们发现仅凭这两个变量并不能完全解释个人的收入差异问题。比如,即使两个受过同等教育的人,在同一时间进入职场,他们的收入也可能存在明显差异;而工作经验相同的两个人,即使他们的受教育程度相同,并且在同一个行业、同一个企业,甚至同一生产部门,其收入也可能存在一定差异。在社交媒体上,既有人宣扬“知识改变命运”,也有人大力鼓吹“读书无用论”,由此可见,影响收入的因素是多种多样、错综复杂的。
二、数据理解
2.1 数据收集
收入的影响因素是复杂多样的,不仅涉及到个人,还受到家庭乃至国家不同因素的影响,涉及的指标数量庞大且难以获取,为简化模型和分析过程,本文数据来自UCI Machine Learning Repository网站的Adult Data Set数据集(https://archive.ics.uci.edu/ml/datasets/adult)。Adult Data Set数据集是Barry Becker从1994年的人口普查数据库中整理筛选得到的,数据收集和整理过程规范统一,数据质量和可信度高,样本量充足且缺失值、异常值较少,能够一定程度上保证模型的质量和可信度。
2.2数据描述
本文选用的数据集共包含3个文件,adult.names包含了数据集的说明和对数据集各项指标的解释,adult.data和adult.test为数据集作者划分的训练集和测试集,为便于对数据进行整理和分析,本文将adult.data和adult.test两个数据集进行合并,在训练模型时对训练集和测试集进行重新分割。本文采用的数据集共包含48842个样本15个指标。15个指标中6个指标为连续型指标,其余9个指标为离散型指标,其名称及属性如下表所示:
| 指标 | 指标名 | 指标类型 | 变量值 |
|---|---|---|---|
| age | 年龄 | 连续型 | |
| workclass | 工作类型 | 离散型 | Private(私人); Self-emp-not-inc(自由职业非公司); Self-emp-inc(自由职业公司); Federal-gov(联邦政府); Local-gov(地方政府); State-gov(州政府); Without-pay(无薪); Never-worked(无工作经验) |
| final-weight | 样本权重 | 连续型 | |
| education | 受教育程度 | 离散型 | Bachelors(学士); Some-college(大学未毕业); 11th(高二); HS-grad(高中毕业); Prof-school(职业学校); Assoc-acdm(大学专科); Assoc-voc(准职业学位); 9th(初三),7th-8th(初中1-2年级); 12th(高三); Masters(硕士); 1st-4th(小学1-4年级); 10th(高一); Doctorate(博士); 5th-6th(小学5-6年级); Preschool(幼儿园) |
| education-num | 受教育时长 | 连续型 | |
| marital-status | 婚姻情况 | 离散型 | Married-civ-spouse(已婚平民配偶); Divorced(离婚); Never-married(未婚); Separated(分居); Widowed(丧偶); Married-spouse-absent(已婚配偶异地); arried-AF-spouse(已婚军属) |
| occupation | 职业 | 离散型 | Tech-support(技术支持); Craft-repair(手工艺维修); Other-service(其他职业); Sales(销售); Exec-managerial(执行主管); Prof-specialty(专业技术); Handlers-cleaners(劳工保洁); Machine-op-inspct(机械操作); Adm-clerical(管理文书); Farming-fishing(农业捕捞); Transport-moving(运输); Priv-house-serv(家政服务); Protective-serv(保安); Armed-Forces(军人) |
| relationship | 家庭角色 | 离散型 | Wife(妻子); Own-child(孩子); Husband(丈夫); Not-in-family(离家); Other-relative(其他关系); Unmarried(未婚) |
| race | 种族 | 离散型 | White(白人); Asian-Pac-Islander(亚裔、太平洋岛裔); Amer-Indian-Eskimo(美洲印第安裔、爱斯基摩裔); Black(非裔); Other(其他) |
| sex | 性别 | 离散型 | Female(女); Male(男) |
| capital-gain | 资本收益 | 连续型 | |
| capital-loss | 资本支出 | 连续型 | |
| hours-per-week | 周工作小时数 | 连续型 | |
| country | 国籍 | 离散型 | United-States(美国); Cambodia(柬埔寨); England(英国); Puerto-Rico(波多黎各); Canada(加拿大); Germany(德国); Outlying-US(Guam-USVI-etc) (美国海外属地); India(印度); Japan(日本); Greece(希腊); South(南美); China(中国); Cuba(古巴); Iran(伊朗); Honduras(洪都拉斯); Philippines(菲律宾); Italy(意大利); Poland(波兰); Jamaica(牙买加),Vietnam(越南); Mexico(墨西哥); Portugal(葡萄牙); Ireland(爱尔兰); France(法国); Dominican-Republic(多米尼加共和国); Laos(老挝); Ecuador(厄瓜多尔); Taiwan(台湾); Haiti(海地); Columbia(哥伦比亚); Hungary(匈牙利); Guatemala(危地马拉); Nicaragua(尼加拉瓜); Scotland(苏格兰); Thailand(泰国); Yugoslavia(南斯拉夫); El-Salvador(萨尔瓦多); Trinadad&Tobago(特立尼达和多巴哥); Peru(秘鲁); Hong(香港); Holand-Netherlands(荷兰) |
| income-level | 收入等级 | 离散型 | <=50K; >50K |
三、数据准备
本文采用基于Python3的Jupyter Notebook作为模型和分析工具。Jupyter Notebook是一个基于Web的交互式数据科学和科学计算工具,因为其功能强大,使用灵活,已广泛被亚马逊、谷歌、微软等互联网企业应用于科学计算,并已经成为云计算的一个流行的用户界面。而Python作为一门新兴的编程语言,其语法简洁,易于部署,功能强大,在数据挖掘和机器学习领域已得到广泛的应用。
3.1 数据导入
(1)首先下载本文用到的Adult Data Set的两个数据集,存放于dataset目录中。
(2)新建文档并导入本文分析所用到的工具包
1.	## 导入相关数据包
2.	# 数据处理
3.	import time, datetime, math, random
4.	from io import StringIO
5.	import numpy as np
6.	import pandas as pd
7.	from sklearn.model_selection import train_test_split
8.	# 可视化
9.	import matplotlib.pyplot as plt  # 绘图
10.	import missingno  # 缺失值可视化
11.	import seaborn as sns  # 绘图库
12.	from pandas.plotting import scatter_matrix #绘制散布矩阵图
13.	# 分类模型
14.	# import sklearn.ensemble as ske # 包含了一套分类算法
15.	from sklearn import datasets, model_selection, tree, preprocessing, metrics, linear_model
16.	from sklearn.ensemble import RandomForestClassifier, GradientBoostingClassifier
17.	from sklearn.neighbors import KNeighborsClassifier
18.	from sklearn.naive_bayes import GaussianNB
19.	from sklearn.linear_model import LinearRegression, LogisticRegression, Ridge, Lasso, SGDClassifier
20.	from sklearn.tree import DecisionTreeClassifier
21.	from sklearn.ensemble import AdaBoostClassifier
22.	from sklearn.ensemble import VotingClassifier
23.	from sklearn.svm import SVC
24.	# 自动调参器 - 随机探索
25.	import scipy.stats as st
26.	from scipy.stats import randint as sp_randint # 随机变量
27.	from sklearn.model_selection import RandomizedSearchCV # 自动调参工具(随机采样)
28.	# 计算模型评价指标
29.	from sklearn.metrics import precision_recall_fscore_support, roc_curve, auc
30.	from sklearn.metrics import precision_recall_curve
31.	from sklearn.metrics import average_precision_score, f1_score, precision_score, recall_score
32.	# 控制提示信息
33.	import warnings
34.	warnings.filterwarnings('ignore')
35.	# 便于在notebook中显示图形并可省略plt.show(),简化代码
36.	%matplotlib inline
(3)导入两个数据集并进行合并
使用panda的read_csv()方法读取两个数据集至DataFrame,将其合并。
headers = ['age', 'workclass', 'final-weight',
           'education', 'education-num',
           'marital-status', 'occupation',
           'relationship', 'race', 'sex',
           'capital-gain', 'capital-loss',
           'hours-per-week', 'country',
           'income-level']  # 定义数据表头即参数名
adult_data = pd.read_csv('dataset/adult.data',
                       header=None,
                       names=headers,
                       sep=',\s',
                       na_values=["?"],
                       engine='python')  # 导入数据集给出的训练集
adult_test = pd.read_csv('dataset/adult.test',
                      header=None,
                      names=headers,
                      sep=',\s',
                      na_values=["?"],
                      engine='python',
                      skiprows=1)  # 导入数据集给出的测试集
dataset = adult_data.append(adult_test)  # 合并两个数据集
# 由于导入时分别为两数据集添加了索引,故对合并后的DataFrame重新创建索引并覆盖原索引
dataset.reset_index(inplace=True, drop=True)
3.2 数据预处理
3.2.1 查看数据缺失情况
(1)绘制缺失值矩阵图
对数据的缺失情况可视化,使用方块代表指标,方块中的留白代表数据缺失及缺失的位置,便于观察各指标数据缺失以及数据缺失的分布情况。
missingno.matrix(dataset, figsize = (20,5))
由表中可以看出,工作类型(workclass)、职业(occupation)和国籍(country)存在的缺失值较多。工作类型和职业的缺失具有一定的相关性。
(2)绘制缺失值柱状图
缺失值柱状图通过统计各指标缺失值情况,并以条形图展现指标缺失值数量。
missingno.bar(dataset, sort='ascending', figsize = (20,5))
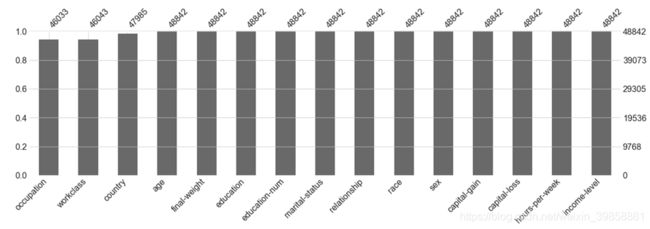
通过缺失值柱状图可以看出,工作类型(workclass)、职业(occupation)和国籍(country)均存在不同程度的缺失,其余指标无缺失值,其中工作类型缺失值最多,其次为职业(occupation)和国籍(country)。
3.2.2 处理缺失值
通过3.2.1对缺失值情况的分析我们可以看出数据集的缺失值数量较少,忽略含有缺失值的样本对整体数据影响很小,故采取直接删除含有缺失值样本的方法对缺失值进行处理,并对处理后的数据进行描述。
dataset.dropna(axis=0, how='any', inplace=True)
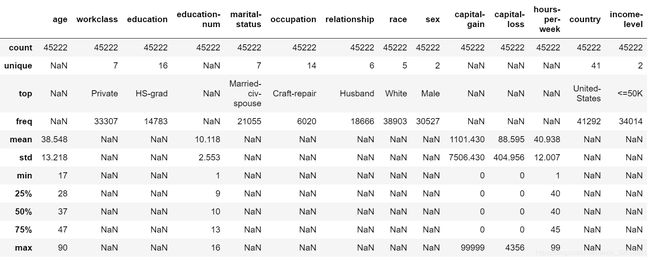
dataset.describe(include='all')
由下表可见,去除缺失值后的数据集共包含45222个有效样本,删除含有缺失值的样本3620个,占原样本量的7.4%。
3.2.3 处理数据异常
通过3.2.2删除缺失值后的数据描述,我们注意到离散型变量收入等级指标(income-level)存在4种类型的值,与样本给出的说明不符。通过对数据集进行观察,我们发现在adult.data中标签为“<=50K”和“>50K”,而在adult.test中的标签为 “<=50K.”和“>50K.”。因此,我们对这种不一致问题进行处理,合并同义标签。
此外,样本权重(final-weight)指标对于本题目来说无实际意义,故删除该指标。
# 处理年收入指标
dataset.loc[dataset['income-level'] == '>50K.', 'income-level'] = '>50K'
dataset.loc[dataset['income-level'] == '<=50K.', 'income-level'] = '<=50K'
# 删除无用的final-weight指标
dataset = dataset.drop(['final-weight'],axis=1)
3.3 数据整体描述
3.3.1 预览数据
通过预览数据的一部分,可以大致了解数据各指标的类型。
dataset.head(5) # 预览数据前5行
3.3.2 描述性统计
对数据进行描述性统计,对于连续型变量,计算其有效值数量、平均值、标准差、最小值,25%分位数、50%分位数、75%分位数以及最大值;对于离散型变量,统计其有效值数量、类别数量、出现最多的类别及其频次。
# 对数值变量进行描述
dataset.describe(include='all')
3.3.3 绘制变量的分布情况
绘制条形图对各指标的分析情况进行描述。
# 绘制每个变量的分布状况
def plot_distribution(dataset, cols, width, height, hspace, wspace):
    plt.style.use('seaborn-whitegrid')
    fig = plt.figure(figsize=(width,height))
    fig.subplots_adjust(left=None, bottom=None, right=None, top=None, wspace=wspace, hspace=hspace)
    rows = math.ceil(float(dataset.shape[1]) / cols)
    for i, column in enumerate(dataset.columns):
        ax = fig.add_subplot(rows, cols, i + 1)
        ax.set_title(column)
        if dataset.dtypes[column] == np.object:
            g = sns.countplot(y=column, data=dataset)
            substrings = [s.get_text()[:18] for s in g.get_yticklabels()]
            g.set(yticklabels=substrings)
            plt.xticks(rotation=25)
        else:
            g = sns.distplot(dataset[column])
            plt.xticks(rotation=25)

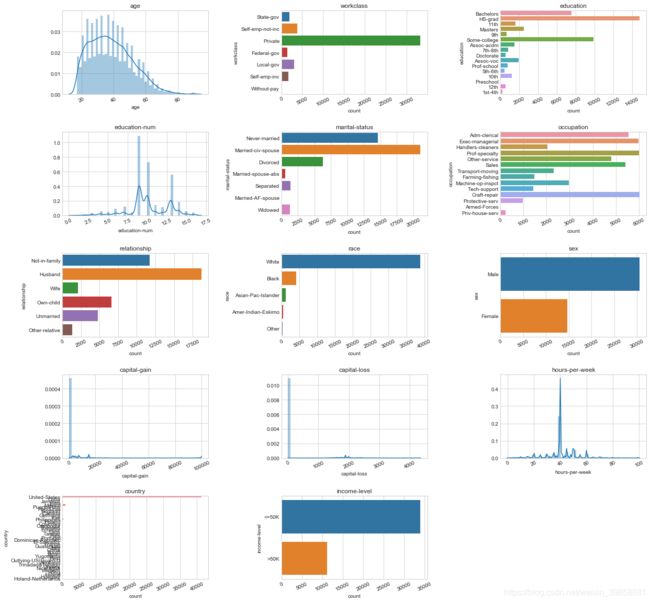
plot_distribution(dataset, cols=3, width=20, height=20, hspace=0.45, wspace=0.5)
从图中我们可以看出,样本的年龄主要集中在20~40岁之间,呈现出正偏态的分布状态;工作类型主要为个人,其他工作类型的样本相对较少;教育程度以高中和大学为主;教育时长以9-10年为主,大部分均达到了7.5年以上;职业类型中执行主管、专业技术和手工艺维修居多,而以军人为职业的样本较少;家庭角色指标中样本多数为丈夫,其次为离家状态;调查的对象中白人占据了大多数,而其他族裔的数量较少;样本的性别以男性为主,占到总样本的约2/3;数据中的大多数样本均来自美国,没有资本收入和资本支出,每周工作40小时左右;样本中收入水平小于$50K的数量较多,约为收入水平大于$50K样本的3倍。
此外,我们还发现部分分类指标类别过多,且部分指标样本数过少,为解决此问题,对部分类别过多的分类指标进行处理。
3.4 对分类指标进行调整
3.4.1 工作类型
本数据集中,工作类型(workclass)指标共有8种类别:私人(Private)、自由职业非公司(Self-emp-not-inc)、自由职业公司(Self-emp-inc)、联邦政府(Federal-gov)、地方政府(Local-gov)、州政府(State-gov)、无薪(Without-pay)、无工作经验(Never-worked)。绘制条形图查看各类样本数量。
plt.style.use('seaborn-whitegrid')
plt.figure(figsize=(15, 4))
sns.countplot(y="workclass", data=dataset);

从上述条形图可见,私营工作在样本中占比较大,不工作和无收入工作样本数量极小,结合实际情况,将其归纳为5类。
dataset.loc[dataset['workclass'] == 'Without-pay', 'workclass'] = 'Not Working'
dataset.loc[dataset['workclass'] == 'Never-worked', 'workclass'] = 'Not Working'
dataset.loc[dataset['workclass'] == 'Federal-gov', 'workclass'] = 'Fed-gov'
dataset.loc[dataset['workclass'] == 'State-gov', 'workclass'] = 'Non-fed-gov'
dataset.loc[dataset['workclass'] == 'Local-gov', 'workclass'] = 'Non-fed-gov'
dataset.loc[dataset['workclass'] == 'Self-emp-not-inc', 'workclass'] = 'Self-emp'
dataset.loc[dataset['workclass'] == 'Self-emp-inc', 'workclass'] = 'Self-emp'
dataset.loc[dataset['workclass'] == ' Private', 'workclass'] = ' Private'

plt.style.use('seaborn-whitegrid')
fig = plt.figure(figsize=(15, 4))
sns.countplot(y="workclass", data=dataset);
3.4.2 职业
本数据集中职业共有14种类型如下:Tech-support(技术支持), Craft-repair(手工艺维修), Other-service(其他职业),Sales(销售), Exec-managerial(执行主管), Prof-specialty(专业技术),Handlers-cleaners(劳工保洁), Machine-op-inspct(机械操作), Adm-clerical(管理文书),Farming-fishing(农业捕捞), Transport-moving(运输), Priv-house-serv(家政服务),Protective-serv(保安), Armed-Forces(军人)。
plt.style.use('seaborn-whitegrid')
plt.figure(figsize=(15,5))
sns.countplot(y="occupation", data=dataset);
dataset.loc[dataset['occupation'] == 'Adm-clerical', 'occupation'] = 'Admin'  # 行政文员
dataset.loc[dataset['occupation'] == 'Armed-Forces', 'occupation'] = 'Military'  # 军队
dataset.loc[dataset['occupation'] == 'Protective-serv', 'occupation'] = 'Military'# 军队
dataset.loc[dataset['occupation'] == 'Craft-repair', 'occupation'] = 'Manual Labour'# 体力劳动者
dataset.loc[dataset['occupation'] == 'Transport-moving', 'occupation'] = 'Manual Labour'  # 体力劳动者
dataset.loc[dataset['occupation'] == 'Farming-fishing', 'occupation'] = 'Manual Labour'  # 体力劳动者
dataset.loc[dataset['occupation'] == 'Handlers-cleaners', 'occupation'] = 'Manual Labour'  # 体力劳动者
dataset.loc[dataset['occupation'] == 'Machine-op-inspct', 'occupation'] = 'Manual Labour'  # 体力劳动者
dataset.loc[dataset['occupation'] == 'Exec-managerial', 'occupation'] = 'Office Labour'  # 文书工作
dataset.loc[dataset['occupation'] == 'Sales', 'occupation'] = 'Office Labour'  # 文书工作
dataset.loc[dataset['occupation'] == 'Tech-support', 'occupation'] = 'Office Labour'  # 文书工作
dataset.loc[dataset['occupation'] == 'Other-service', 'occupation'] = 'Service'# 服务人员
dataset.loc[dataset['occupation'] == 'Priv-house-serv', 'occupation'] = 'Service'# 服务人员
dataset.loc[dataset['occupation'] == 'Prof-specialty', 'occupation'] = 'Professional'# 技术人员

plt.style.use('seaborn-whitegrid')
fig = plt.figure(figsize=(20,3))
sns.countplot(y="occupation", data=dataset);
3.4.3 国籍
数据说明里共列出41个国家和地区,除美国外大部分国家和地区的样本都很少,故在此按照地域对这些国家和地区进行合并。
dataset.loc[dataset['country'] == 'China', 'country'] = 'East-Asia'
dataset.loc[dataset['country'] == 'Hong', 'country'] = 'East-Asia'
dataset.loc[dataset['country'] == 'Taiwan', 'country'] = 'East-Asia'
dataset.loc[dataset['country'] == 'Japan', 'country'] = 'East-Asia'

dataset.loc[dataset['country'] == 'Thailand', 'country'] = 'Southeast-Asia'
dataset.loc[dataset['country'] == 'Vietnam', 'country'] = 'Southeast-Asia'
dataset.loc[dataset['country'] == 'Laos', 'country'] = 'Southeast-Asia'
dataset.loc[dataset['country'] == 'Philippines', 'country'] = 'Southeast-Asia'
dataset.loc[dataset['country'] == 'Cambodia', 'country'] = 'Southeast-Asia'

dataset.loc[dataset['country'] == 'Columbia', 'country'] = 'South-America'
dataset.loc[dataset['country'] == 'Cuba', 'country'] = 'South-America'
dataset.loc[dataset['country'] == 'Dominican-Republic', 'country'] = 'South-America'
dataset.loc[dataset['country'] == 'Ecuador', 'country'] = 'South-America'
dataset.loc[dataset['country'] == 'Guatemala', 'country'] = 'South-America'
dataset.loc[dataset['country'] == 'El-Salvador', 'country'] = 'South-America'
dataset.loc[dataset['country'] == 'Haiti', 'country'] = 'South-America'
dataset.loc[dataset['country'] == 'Honduras', 'country'] = 'South-America'
dataset.loc[dataset['country'] == 'Mexico', 'country'] = 'South-America'
dataset.loc[dataset['country'] == 'Nicaragua', 'country'] = 'South-America'
dataset.loc[dataset['country'] == 'Outlying-US(Guam-USVI-etc)'  , 'country'] = 'South-America'
dataset.loc[dataset['country'] == 'Peru', 'country'] = 'South-America'
dataset.loc[dataset['country'] == 'Jamaica', 'country'] = 'South-America'
dataset.loc[dataset['country'] == 'Puerto-Rico', 'country'] = 'South-America'
dataset.loc[dataset['country'] == 'Trinadad&Tobago', 'country'] = 'South-America'

dataset.loc[dataset['country'] == 'Canada', 'country'] = 'British-Commonwealth'
dataset.loc[dataset['country'] == 'England', 'country'] = 'British-Commonwealth'
dataset.loc[dataset['country'] == 'India', 'country'] = 'British-Commonwealth'
dataset.loc[dataset['country'] == 'Ireland', 'country'] = 'British-Commonwealth'
dataset.loc[dataset['country'] == 'Scotland', 'country'] = 'British-Commonwealth'

dataset.loc[dataset['country'] == 'France', 'country'] = 'Europe'
dataset.loc[dataset['country'] == 'Germany', 'country'] = 'Europe'
dataset.loc[dataset['country'] == 'Italy', 'country'] = 'Europe'
dataset.loc[dataset['country'] == 'Holand-Netherlands', 'country'] = 'Europe'
dataset.loc[dataset['country'] == 'Greece', 'country'] = 'Europe'
dataset.loc[dataset['country'] == 'Hungary', 'country'] = 'Europe'
dataset.loc[dataset['country'] == 'Iran', 'country'] = 'Europe'
dataset.loc[dataset['country'] == 'Yugoslavia', 'country'] = 'Europe'
dataset.loc[dataset['country'] == 'Poland', 'country'] = 'Europe'
dataset.loc[dataset['country'] == 'Portugal', 'country'] = 'Europe'
dataset.loc[dataset['country'] == 'South', 'country'] = 'Europe'

dataset.loc[dataset['country'] == 'United-States', 'country'] = 'United-States'

plt.style.use('seaborn-whitegrid')
fig = plt.figure(figsize=(15,4))
sns.countplot(y="country", data=dataset);
将国家合并为地区后,虽然与美国相比仍差异较大,但是各类别样本数量更加均匀。

3.4.4 受教育程度
绘制受教育程度条形图,观察数据分布情况。
plt.style.use('seaborn-whitegrid')
plt.figure(figsize=(15,5))
sns.countplot(y="education", data=dataset);
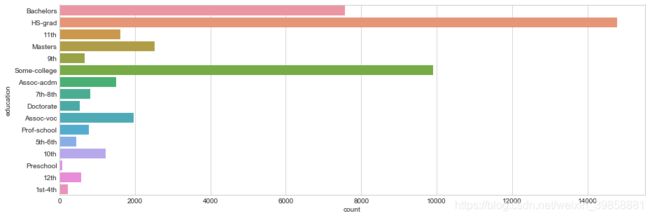
从上图可见,受教育程度类别多达16个,通过生成条形图可以看出低教育水平的各类别数量较少,故以高中为界,将其整合为一类(dropout),对两类高中(HS-Graduate)和两类专科(Associate)也进行合并。
dataset.loc[dataset['education'] == 'Preschool', 'education'] = 'Dropout'  # 退学
dataset.loc[dataset['education'] == '1st-4th', 'education'] = 'Dropout'  # 退学
dataset.loc[dataset['education'] == '5th-6th', 'education'] = 'Dropout'  # 退学
dataset.loc[dataset['education'] == '7th-8th', 'education'] = 'Dropout'  # 退学
dataset.loc[dataset['education'] == '9th', 'education'] = 'Dropout'  # 退学
dataset.loc[dataset['education'] == '10th', 'education'] = 'Dropout'  # 退学
dataset.loc[dataset['education'] == '11th', 'education'] = 'Dropout'  # 退学
dataset.loc[dataset['education'] == '12th', 'education'] = 'Dropout'  # 退学
dataset.loc[dataset['education'] == 'Assoc-acdm', 'education'] = 'Associate'  # 专科
dataset.loc[dataset['education'] == 'Assoc-voc', 'education'] = 'Associate'  # 专科
dataset.loc[dataset['education'] == 'HS-Grad', 'education'] = 'HS-Graduate'  # 高中
dataset.loc[dataset['education'] == 'Some-college', 'education'] = 'HS-Graduate'  # 高中
dataset.loc[dataset['education'] == 'Prof-school', 'education'] = 'Professor'  # 职业
dataset.loc[dataset['education'] == 'Bachelors', 'education'] = 'Bachelors'  # 学士
dataset.loc[dataset['education'] == 'Masters', 'education'] = 'Masters'  # 硕士
dataset.loc[dataset['education'] == 'Doctorate', 'education'] = 'Doctorate'  # 博士

plt.style.use('seaborn-whitegrid')
fig = plt.figure(figsize=(15,4))
sns.countplot(y="education", data=dataset);
3.4.5 婚姻状态
数据说明里共列出7种婚姻状态Married-civ-spouse(已婚平民配偶), Divorced(离婚), Never-married(未婚), Separated(分居), Widowed(丧偶), Married-spouse-absent(已婚配偶异地), arried-AF-spouse(已婚军属)。
plt.style.use('seaborn-whitegrid')
plt.figure(figsize=(10,3))
sns.countplot(y="marital-status", data=dataset);
dataset.loc[dataset['marital-status'] == 'Never-married', 'marital-status'] = 'Never-Married'  # 从未结婚
dataset.loc[dataset['marital-status'] == 'Divorced', 'marital-status'] = 'Divorced'# 离异
dataset.loc[dataset['marital-status'] == 'Widowed', 'marital-status'] = 'Widowed'# 丧偶
dataset.loc[dataset['marital-status'] == 'Married-spouse-absent', 'marital-status'] = 'Separated'  # 分居
dataset.loc[dataset['marital-status'] == 'Separated', 'marital-status'] = 'Separated'# 分居
dataset.loc[dataset['marital-status'] == 'Married-AF-spouse', 'marital-status'] = 'Married'  # 已婚
dataset.loc[dataset['marital-status'] == 'Married-civ-spouse', 'marital-status'] = 'Married'  # 已婚

plt.style.use('seaborn-whitegrid')
fig = plt.figure(figsize=(10,3))
sns.countplot(y="marital-status", data=dataset);
3.5 查看调整后各指标分布情况
由于plot_distribution()函数在上文中已定义,故在此直接调用
plot_distribution(dataset, cols=3, width=20, height=20, hspace=0.45, wspace=0.5)

从上图可见,经过调整后,部分分类指标存在的类别过于复杂、部分类别样本数量过少的问题得到了一定程度的缓解。
3.6 检查变量间相关关系
为了探索变量间可能存在的相互影响的问题,本文通过计算变量间的相关系数对其可能存在的交互作用进行检查。
(1)复制原数据集,并将其中离散的字符串变量转化为数值,以便进行后续分析。
dataset_num = dataset.copy() # 复制数据集

dataset_num['workclass'] = dataset_num['workclass'].factorize()[0]
dataset_num['education'] = dataset_num['education'].factorize()[0]
dataset_num['marital-status'] = dataset_num['marital-status'].factorize()[0]
dataset_num['occupation'] = dataset_num['occupation'].factorize()[0]
dataset_num['relationship'] = dataset_num['relationship'].factorize()[0]
dataset_num['race'] = dataset_num['race'].factorize()[0]
dataset_num['sex'] = dataset_num['sex'].factorize()[0]
dataset_num['country'] = dataset_num['country'].factorize()[0]
dataset_num['income-level'] = dataset_num['income-level'].factorize()[0]
(2)绘制变量间的相关关系图谱,探索变量间的相关性。
plt.style.use('seaborn-whitegrid')
fig = plt.figure(figsize=(15, 15))

mask = np.zeros_like(dataset_num.corr(), dtype=np.bool)
mask[np.triu_indices_from(mask)] = True
sns.heatmap(dataset_num.corr(), vmin=-1, vmax=1, square=True,
            cmap=sns.color_palette("RdBu_r", 100),
            mask=mask, annot=True, linewidths=.5);

通过相关关系分析,我们可以看出变量间没有较为明显的共线性,故不对变量进行筛选。
3.7 切分数据集
完成数据集的清洗和处理后,即可对数据集进行切分,为后续训练和测试模型分类能力做准备。
(1)切分自变量和因变量
本文目的为通过人口普查数据对个体的收入水平进行预测,故因变量为收入水平(income-level),其余变量作为自变量,分别存入y_data和x_data。
# 切分自变量和因变量
y_data=dataset_num['income-level']  # 取收入水平income-level列
x_data=dataset_num.drop(['income-level'],axis=1)  # 排除收入水平income-level列,剩下的列作为X_data
(2)切分训练集和测试集
在切分数据集方面,本文参考了Agarwal和Saxena(2018)[1]在利用机器学习进行恶性肿瘤分析中使用的方法,使用scikit-learn提供的train_test_split()将数据集切分为训练集和测试集,测试集占整个数据集的20%,训练集占整个数据集的80%。并按照因变量中各类别的比例进行均分,得到训练集变量x_train和y_train,以及测试集变量x_test和y_test。
# 切分训练集和测试集
x_train,x_test,y_train,y_test = train_test_split(
    x_data,
    y_data,
    test_size=0.2,
    random_state=1,
    stratify=y_data)
四、建模
本数据集作为当前较为热门的分类数据集,从其发布至今,已有众多学者围绕本数据集开展不同分类器的研究,如Kohavi(1996)[2]使用朴素贝叶斯方法对模型进行了分析,Deepajothi和Selvarajan(2012)[3]比较了贝叶斯分类器和决策树分类器在收入水平分类上的预测效果,Mangasarian和Musicant(1999)[4]则构建了使用支持向量机对收入进行分类的方法。
为了实现较高的分类准确率,本文结合课程所学,并参考引用本数据集进行分析的相关文献的方法,一共构建了10种不同类型的分类器,使用同一组训练集进行训练,对于构建模型的超参数,借助Python中scikit-learn库提供的随机搜索器RandomizedSearchCV()通过多轮训练筛选最优参数,模型建构完成后,使用同一组测试集对10个模型进行测试,保证模型比较的公平性,并从中筛选出表现最优的模型。
4.1 构建模型训练测试函数
本文采用的各个模型均借助Python3下的Scikit-learn库构建。Scikit-learn是用Python编写的通用机器学习库[5],是机器学习领域最知名的Python模块之一,提供通用性、模块化的算法实现[6],其模型构建灵活,种类丰富,模型构建和分析的相关工具较为齐全,故各分类器间除参数不一致外,训练模型、测试模型以及生成各类评价参数的步骤大致相同[7],为简化程序代码本文首先构建模型训练的方法fit_ml_algo()、超参数报告report()以及计算TPR、FPR并绘制ROC曲线的方法plot_roc_curve()。
4.1.1 构建模型训练方法fit_ml_algo()
该方法用于构建统一的模型训练过程,传入设置好超参数的模型、训练集、测试集以及k折交叉验证的折数(cv)后,即使用训练集对模型进行训练,使用训练好的模型对x_test进行预测得到test_pred,使用predict_proba计算测试样本属于不同类别的概率,并使用K折交叉检验再次对模型进行训练,并返回训练结果和模型评价指标。
# 构造一个模型套用的样板,自动调用训练集对传入的模型进行训练,使用验证集对模型进行检验,并输出相关指标
def fit_ml_algo(algo, X_train, y_train, X_test, cv):
    model = algo.fit(X_train, y_train)
    test_pred = model.predict(X_test)
    try:
        probs = model.predict_proba(X_test)[:,1]
    except Exception as e:
        probs = "Unavailable"
        print('Warning: Probs unavaliable.')
        print('Reason: ', e)


    acc = round(model.score(X_test, y_test) * 100, 2)
    # CV
    train_pred = model_selection.cross_val_predict(algo,
                                                  X_train,
                                                  y_train,
                                                  cv=cv,
                                                  n_jobs = -1)
    acc_cv = round(metrics.accuracy_score(y_train, train_pred) * 100, 2)
    return train_pred, test_pred, acc, acc_cv, probs
4.1.2 构建超参数报告方法report()
本方法用于对调参工具RandomizedSearchCV()运算得到的候选模型进行排序,并汇报效果较为优秀的模型的超参数。相较于采用网格搜索的模型调参方法GridSearchCV(),RandomizedSearchCV()不会评估所有可能的超参数组合,所以它的计算开销和耗时较少,能够更高效快速地筛选更适合所研究问题的超参数[8]。
# 汇报候选模型参数
def report(results, n_top=5):
    for i in range(1, n_top + 1):
        candidates = np.flatnonzero(results['rank_test_score'] == i)
        for candidate in candidates:
            print("Model with rank: {0}".format(i))
            print("Mean validation score: {0:.3f} (std: {1:.3f})".format(
                  results['mean_test_score'][candidate],
                  results['std_test_score'][candidate]))
            print("Parameters: {0}\n".format(results['params'][candidate]))
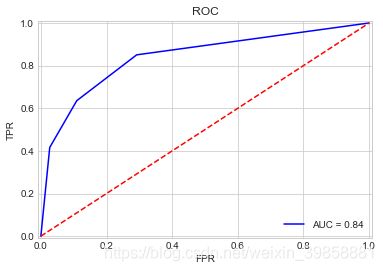
4.1.3 构建ROC曲线方法plot_roc_curve()
该方法用于计算TPR(True Positive Rate)和FPR(False Positive Rate)并绘制ROC曲线。
# 构建函数用于计算TPR(True Positive Rate)和FPR(False Positive Rate)并绘制ROC曲线
def plot_roc_curve(y_test, preds):
    fpr, tpr, threshold = metrics.roc_curve(y_test, preds)
    roc_auc = metrics.auc(fpr, tpr)
    plt.title('ROC')
    plt.plot(fpr, tpr, 'b', label = 'AUC = %0.2f' % roc_auc)
    plt.legend(loc = 'lower right')
    plt.plot([0, 1], [0, 1],'r--')
    plt.xlim([-0.01, 1.01])
    plt.ylim([-0.01, 1.01])
    plt.ylabel('TPR')
    plt.xlabel('FPR')
    plt.show()
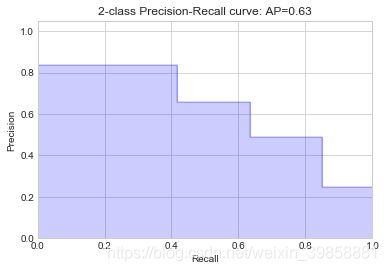
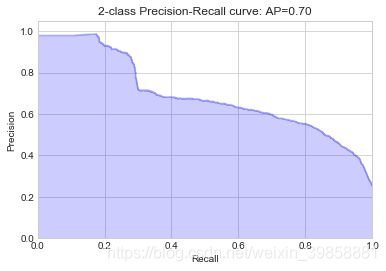
4.1.4 构建P-R曲线方法plot_pr_curve()
# 构建绘制P-R曲线方法
def plot_pr_curve(y_test, probs):
    precision, recall, _ = precision_recall_curve(y_test, probs)
    plt.step(recall, precision, color='b', alpha=0.2,
             where='post')
    plt.fill_between(recall, precision, step='post', alpha=0.2,
                     color='b')
    plt.xlabel('Recall')
    plt.ylabel('Precision')
    plt.ylim([0.0, 1.05])
    plt.xlim([0.0, 1.0])
    plt.title('2-class Precision-Recall curve: AP={0:0.2f}'.format(
              average_precision_score(y_test, probs)))
4.2 构建Logistic回归分类模型
(1)使用随机搜索器RandomizedSearchCV()进行自动调参
# Logistic回归

# 设置超参数并构建随机搜索器
n_iter_search = 10  # 训练10次,数值越大,获得的参数精度越大,但是搜索时间越长
param_dist = {
     'penalty': ['l2', 'l1'],
              'class_weight': [None, 'balanced'],
              'C': np.logspace(-20, 20, 10000),
              'intercept_scaling': np.logspace(-20, 20, 10000)}
random_search = RandomizedSearchCV(LogisticRegression(),   # 使用的分类器
                                   n_jobs=-1, # 使用所有的CPU进行训练,默认为1,使用1个CPU
                                   param_distributions=param_dist,
                                   n_iter=n_iter_search) # 训练次数
start = time.time()
random_search.fit(x_train, y_train)
print("RandomizedSearchCV took %.2f seconds for %d candidates"
      " parameter settings." % ((time.time() - start), n_iter_search))
report(random_search.cv_results_)
运行上述代码,随机搜索器通过多轮随机搜索确定不同超参数下的模型表现,并输出表现排名前5的模型参数集。
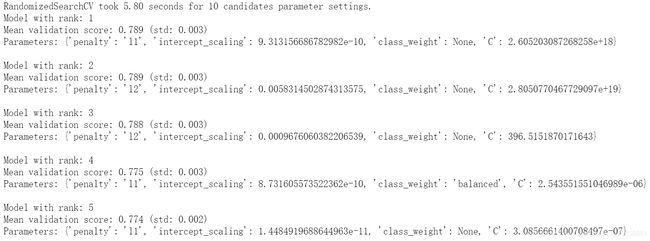
(2)使用上述随机搜索器调参后表现最佳的模型random_search.best_estimator_进行训练并输出模型评价参数。
# 调用随机搜索器得到的参数最优的Logistic回归模型进行训练,
start_time = time.time()
train_pred_log, test_pred_log, acc_log, acc_cv_log, probs_log = fit_ml_algo(
                                                                 random_search.best_estimator_,
                                                                 x_train,
                                                                 y_train,
                                                                 x_test,
                                                                 10)
log_time = (time.time() - start_time)
print("Accuracy: %s" % acc_log)
print("Accuracy CV 10-Fold: %s" % acc_cv_log)
print("Running Time: %s s" % datetime.timedelta(seconds=log_time).seconds)
从输出可以看出,直接训练的准确度为79.1%,使用十折交叉验证得到的模型准确度为78.86%,模型运行时间为1s。

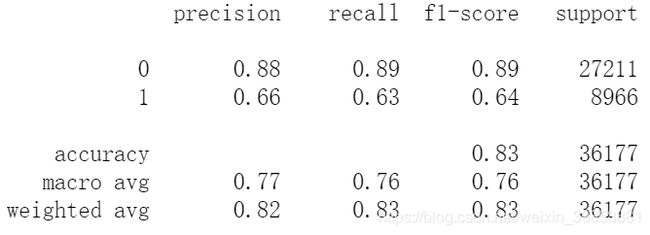
(3)评估训练集的模型表现
# 训练集样本表现
print(metrics.classification_report(y_train, train_pred_log))

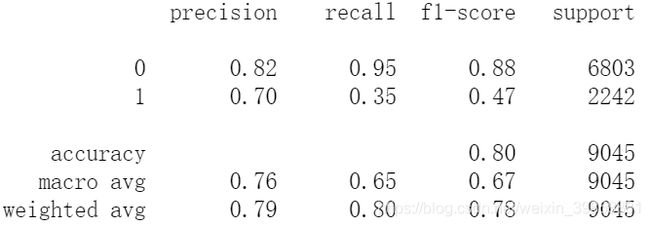
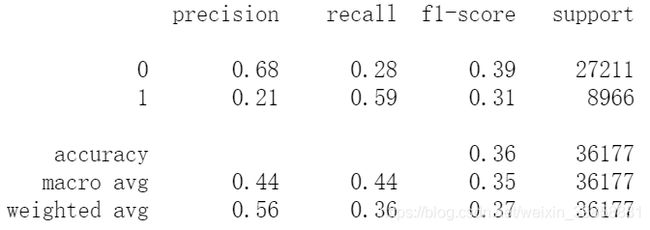
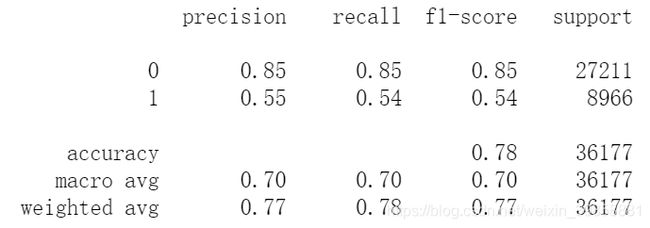
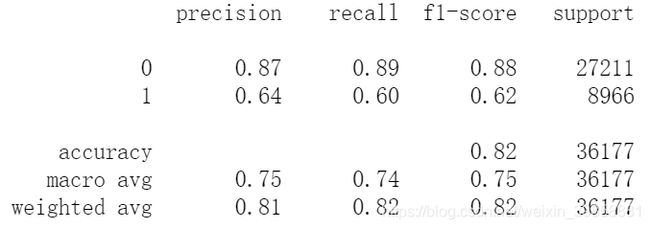
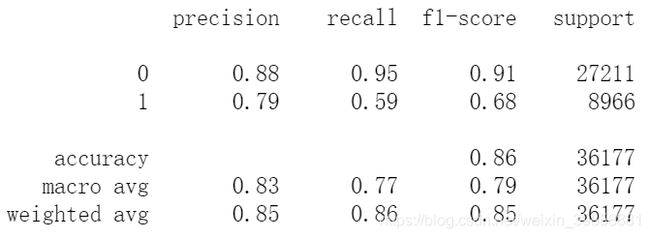
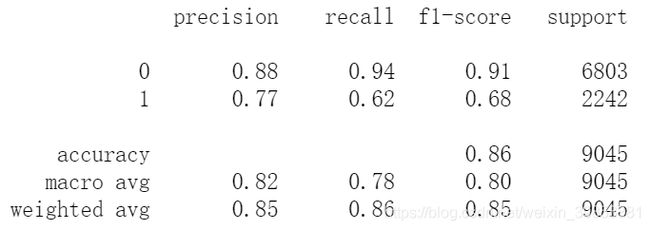
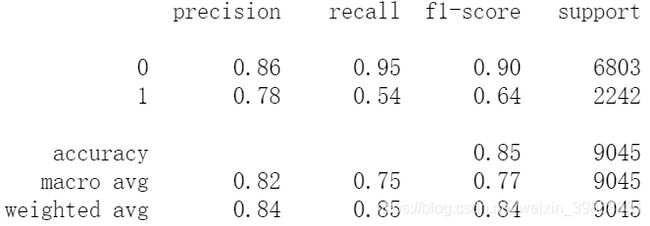
上表中,列表左边的一列为分类的标签名;precision列表示模型预测的结果中有多少是预测正确的,即精度;recall列和f1-score分别为模型的召回率和F1参数,support列为每个标签的出现次数;accuracy为模型的准确度;macro avg和weighted avg分别是加权平均前后的平均值,后续表格同理。
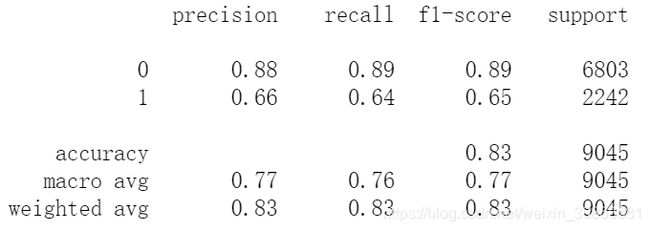
(4)评估训练集的模型表现
# 测试集样本表现
print(metrics.classification_report(y_test, test_pred_log))
# 绘制ROC
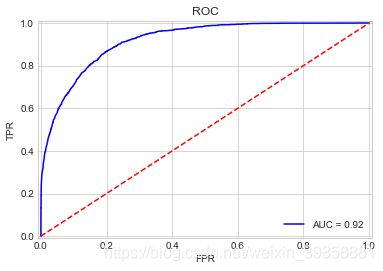
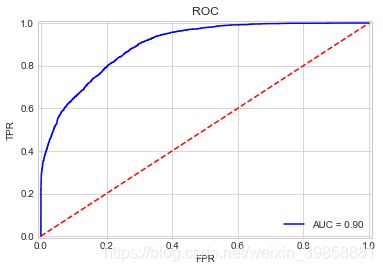
plot_roc_curve(y_test, probs_log)
# 绘制P-R曲线
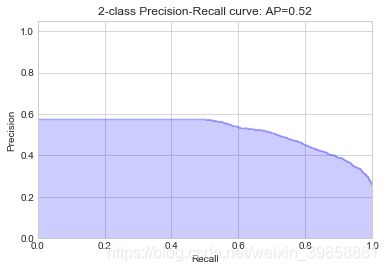
plot_pr_curve(y_test, probs_log)
4.3 构建KNN分类模型
(1)将K近邻的K值设为3,运行该模型
# k-Nearest Neighbors
start_time = time.time()
train_pred_knn, test_pred_knn, acc_knn, acc_cv_knn, probs_knn\
= fit_ml_algo(KNeighborsClassifier(n_neighbors = 3,
                                   n_jobs = -1),
                                   x_train,
                                   y_train,
                                   x_test,
                                   10)
knn_time = (time.time() - start_time)
print("Accuracy: %s" % acc_knn)
print("Accuracy CV 10-Fold: %s" % acc_cv_knn)
print("Running Time: %s s" % datetime.timedelta(seconds=knn_time))
KNN模型的预测准确率为82.74%,十折交叉验证的准确率为82.64%,运算时长48s。

(2)评估训练集的模型表现
# 训练集样本表现
print(metrics.classification_report(y_train, train_pred_knn))
# 测试集样本表现
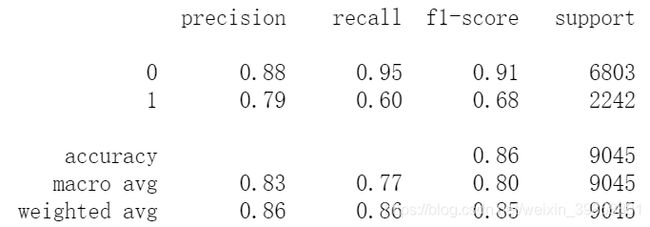
print(metrics.classification_report(y_test, test_pred_knn))
# 绘制ROC
plot_roc_curve(y_test, probs_knn)
# 绘制P-R曲线
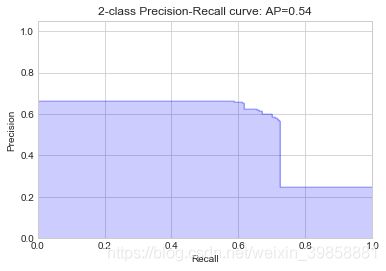
plot_pr_curve(y_test, probs_knn)
4.4 构建朴素贝叶斯分类模型
Scikit-learn的naive_bayes 模块共包含三种朴素贝叶斯实现方式:Gaussian Naive Bayes、Multinomial Naive Bayes、Bernoulli Naive Bayes。Gaussian Naive Bayes多用于一般的分类问题,本题目即属于此类情况;Multinomial Naive Bayes多适用于文本数据(特征表示的是次数,例如某个词语的出现次数);适用于伯努利分布,也适用于文本数据(此时特征表示的是是否出现,例如某个词语的出现为1,不出现为0),绝大多数情况下表现不如多项式分布,但有的时候伯努利分布表现得要比多项式分布要好,尤其是对于小数量级的文本数据。因此,本文采用Gaussian Naive Bayes构建朴素贝叶斯分类模型。
(1)训练和测试朴素贝叶斯模型。
# Gaussian Naive Bayes
start_time = time.time()
train_pred_gaussian, test_pred_gaussian, acc_gaussian, acc_cv_gaussian, probs_gau\
= fit_ml_algo(GaussianNB(),
              x_train,
              y_train,
              x_test,
              10)
gaussian_time = (time.time() - start_time)
print("Accuracy: %s" % acc_gaussian)
print("Accuracy CV 10-Fold: %s" % acc_cv_gaussian)
print("Running Time: %s s" % datetime.timedelta(seconds=gaussian_time).seconds)

该模型预测的准确度达到80.19%,十折交叉验证的准确度为79.88%,运算时间为3s。
(2)评估训练集的模型表现
# 训练集样本表现
print(metrics.classification_report(y_train, train_pred_gaussian))
# 测试集样本表现
print(metrics.classification_report(y_test, test_pred_gaussian))
# 绘制ROC
plot_roc_curve(y_test, probs_gau)
# 绘制P-R曲线
plot_pr_curve(y_test, probs_gau)
4.5 构建支持向量机分类模型
(1)训练并测试支持向量机模型
在构建模型的过程中,本文尝试了Scikit-learn提供的六种不同的SVC内核,模型效果均不太理想且运算速度较慢,相对而言线性内核表现略好,且Mangasarian和Musicant(1999)[4]在基于本文数据集构建SVC模型时,也主要采用了线性内核,故使用线性支持向量机构建本文分类模型。
# Linear SVC
start_time = time.time()
# kernel = ‘linear’, ‘poly’, ‘rbf’, ‘sigmoid’, ‘precomputed’
svc_clf = SVC(probability=True, max_iter=1000, kernel='linear')
train_pred_svc, test_pred_svc, acc_linear_svc, acc_cv_linear_svc, probs_svc\
= fit_ml_algo(svc_clf,
              x_train,
              y_train,
              x_test,
              10)
linear_svc_time = (time.time() - start_time)
print("Accuracy: %s" % acc_linear_svc)
print("Accuracy CV 10-Fold: %s" % acc_cv_linear_svc)
print("Running Time: %s s" % datetime.timedelta(seconds=linear_svc_time).seconds)

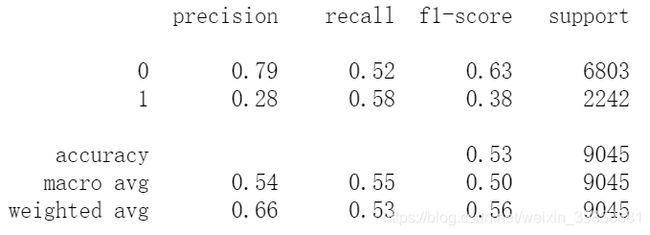
从分析结果可以看出,支持向量机分类器的预测准确度为53.29%,十折交叉验证的准确度为35.68%,模型运算时间74s。
(2)评估训练集的模型表现
# 训练集样本表现
print(metrics.classification_report(y_train, train_pred_svc))
# 测试集样本表现
print(metrics.classification_report(y_test, test_pred_svc))
# 绘制ROC
plot_roc_curve(y_test, probs_svc)
# 绘制P-R曲线
plot_pr_curve(y_test, probs_svc)
4.6 构建随机梯度下降分类模型
随机梯度下降模型采用mini-batch来做梯度下降,在处理大数据的情况下收敛更快。
(1)训练兵测试随机梯度下降模型
# Stochastic Gradient Descent 随机梯度下降
start_time = time.time()
train_pred_sgd, test_pred_sgd, acc_sgd, acc_cv_sgd, probs_sgd\
= fit_ml_algo(
              SGDClassifier(n_jobs = -1, loss='log'),
              x_train,
              y_train,
              x_test,
              10)
sgd_time = (time.time() - start_time)
print("Accuracy: %s" % acc_sgd)
print("Accuracy CV 10-Fold: %s" % acc_cv_sgd)
print("Running Time: %s s" % datetime.timedelta(seconds=sgd_time).seconds)

随机梯度下降分类器模型的预测准确度为77.29%,使用十折交叉检验的准确度为77.94%,运算耗费3s。
(2)评估训练集的模型表现
# 训练集样本表现
print(metrics.classification_report(y_train, train_pred_sgd))
# 测试集样本表现
print(metrics.classification_report(y_test, test_pred_sgd))
# 绘制ROC
plot_roc_curve(y_test, probs_sgd)
# 绘制P-R曲线
plot_pr_curve(y_test, probs_sgd)
4.7 构建决策树分类模型
(1)训练和测试决策树分类模型
# Decision Tree Classifier
start_time = time.time()
train_pred_dt, test_pred_dt, acc_dt, acc_cv_dt, probs_dt\
= fit_ml_algo(DecisionTreeClassifier(),
              x_train,
              y_train,
              x_test,
              10)
dt_time = (time.time() - start_time)
print("Accuracy: %s" % acc_dt)
print("Accuracy CV 10-Fold: %s" % acc_cv_dt)
print("Running Time: %s s" % datetime.timedelta(seconds=dt_time).seconds)

决策树分类模型的预测准确度为82.37%,十折交叉验证的准确度为81.76%,运算耗时1s。
(2)评估训练集的模型表现
# 训练集样本表现
print(metrics.classification_report(y_train, train_pred_dt))
# 测试集样本表现
print(metrics.classification_report(y_test, test_pred_dt))
(4)绘制ROC曲线
# 绘制ROC
plot_roc_curve(y_test, probs_dt)
# 绘制P-R曲线
plot_pr_curve(y_test, probs_dt)
4.8 构建随机森林分类模型
(1)使用随机调参工具查找随机森林算法最优超参数
# 从中调参的超参数集合
param_dist = {
     "max_depth": [10, None],
              "max_features": sp_randint(1, 11),
              "min_samples_split": sp_randint(2, 20),
              "min_samples_leaf": sp_randint(1, 11),
              "bootstrap": [True, False],
              "criterion": ["gini", "entropy"]}

# Run Randomized Search
n_iter_search = 10
random_search = RandomizedSearchCV(
                                   RandomForestClassifier(n_estimators=10),
                                   n_jobs = -1,
                                   param_distributions=param_dist,
                                   n_iter=n_iter_search)

start = time.time()
random_search.fit(x_train, y_train)
print("RandomizedSearchCV took %.2f seconds for %d candidates"
      " parameter settings." % ((time.time() - start), n_iter_search))
report(random_search.cv_results_)
# 使用随机搜索器算得的最优超参数模型进行计算
start_time = time.time()
rfc = random_search.best_estimator_
train_pred_rf, test_pred_rf, acc_rf, acc_cv_rf, probs_rf = fit_ml_algo(
                                                             rfc,
                                                             x_train,
                                                             y_train,
                                                             x_test,
                                                             10)
rf_time = (time.time() - start_time)
print("Accuracy: %s" % acc_rf)
print("Accuracy CV 10-Fold: %s" % acc_cv_rf)
print("Running Time: %s s" % datetime.timedelta(seconds=rf_time).seconds)

训练后的随机森林模型预测的准确度为85.85%,十折交叉检验的准确度为85.65%,运行耗费时间2s。
(3)评估训练集的模型表现
# 测试集样本表现
print(metrics.classification_report(y_train, train_pred_rf))
# 训练集样本表现
print(metrics.classification_report(y_test, test_pred_rf))
# 绘制ROC
plot_roc_curve(y_test, probs_rf)
# 绘制P-R曲线
plot_pr_curve(y_test, probs_rf)
4.9 构建内梯度提升决策树分类模型
(1)训练和测试梯度提升决策树分类模型
# Gradient Boosting Trees 梯度提升决策树
start_time = time.time()
train_pred_gbt, test_pred_gbt, acc_gbt, acc_cv_gbt, probs_gbt\
= fit_ml_algo(GradientBoostingClassifier(),
              x_train,
              y_train,
              x_test,
              10)
gbt_time = (time.time() - start_time)
print("Accuracy: %s" % acc_gbt)
print("Accuracy CV 10-Fold: %s" % acc_cv_gbt)
print("Running Time: %s s" % datetime.timedelta(seconds=gbt_time).seconds)

训练后的梯度提升决策树预测准确度为86.2%,十折交叉检验的准确度为85.97%,训练耗时15s。
(2)评估训练集的模型表现
# 训练集样本表现
print(metrics.classification_report(y_train, train_pred_gbt))
# 测试集样本表现
print(metrics.classification_report(y_test, test_pred_gbt))
# 绘制ROC
plot_roc_curve(y_test, probs_gbt)
# 绘制P-R曲线
plot_pr_curve(y_test, probs_gbt)
4.10 构建AdaBoost分类模型
(1)训练和测试AdaBoost分类模型
# AdaBoost Classifier
start_time = time.time()
train_pred_adb, test_pred_adb, acc_adb, acc_cv_adb, probs_adb\
= fit_ml_algo(AdaBoostClassifier(),
              x_train,
              y_train,
              x_test,
              10)
adb_time = (time.time() - start_time)
print("Accuracy: %s" % acc_adb)
print("Accuracy CV 10-Fold: %s" % acc_cv_adb)
print("Running Time: %s s" % datetime.timedelta(seconds=adb_time).seconds)

AdaBoost模型训练后的预测准确度为85.86%,十折交叉验证的准确度为85.41%,运算耗时6s。
(2)评估训练集的模型表现
# 训练集样本表现
print(metrics.classification_report(y_train, train_pred_adb))
# 测试集样本表现
print(metrics.classification_report(y_test, test_pred_adb))
# 绘制ROC
plot_roc_curve(y_test, probs_adb)
# 绘制P-R曲线
plot_pr_curve(y_test, probs_adb)
4.11 构建投票法分类模型
投票法(Voting Classifier)是集成学习里面针对分类问题的一种结合策略。基本思想是选择所有机器学习算法当中输出最多的那个类。
分类的机器学习算法输出有两种类型:一种是直接输出类标签,另外一种是输出类概率,使用前者进行投票叫做硬投票(Majority/Hard voting),使用后者进行分类叫做软投票(Soft voting)。经过测试,对于本文选用的数据集,Soft Voting模型效果较好,故使用Soft Voting作为投票法分类器的投票模型。
在机器学习算法中,通过比较不同分类器组合的效果,最终选用了Logistic回归分类器、朴素贝叶斯(Gaussian Native Bayes)、随机森林分类器、梯度提升分类器和决策树分类器作为投票算法。
(1)构建、训练和测试投票分类器模型
# Voting Classifier
start_time = time.time()
voting_clf = VotingClassifier(estimators=[
    ('log_clf', LogisticRegression()),
    ('gnb_clf', GaussianNB()),
    ('rf_clf', RandomForestClassifier(n_estimators=10)),
    ('gb_clf', GradientBoostingClassifier()),
    ('dt_clf', DecisionTreeClassifier(random_state=666))],
                             voting='soft', n_jobs = -1)
train_pred_vot, test_pred_vot, acc_vot, acc_cv_vot, probs_vot\
= fit_ml_algo(voting_clf,
              x_train,
              y_train,
              x_test,
              10)
vot_time = (time.time() - start_time)
print("Accuracy: %s" % acc_vot)
print("Accuracy CV 10-Fold: %s" % acc_cv_vot)
print("Running Time: %s s" % datetime.timedelta(seconds=vot_time).seconds)

训练后的投票法分类模型预测准确度为84.72%,十折交叉检验的准确度为84.73%,模型运算耗时21s。
(2)评估训练集的模型表现
# 训练集样本表现
print(metrics.classification_report(y_train, train_pred_vot))
# 测试集样本表现
print(metrics.classification_report(y_test, test_pred_vot))
# 绘制ROC
plot_roc_curve(y_test, probs_vot)
# 绘制P-R曲线
plot_pr_curve(y_test, probs_vot)
五、评估
5.1 指标评估
结合课本内容和Powers(2011)[9]对各项模型评价指标的对比分析和介绍,本文最终选用准确率(Accuracy)、精确率(Precision)、召回率(Recall)、F1分数、作为主要的评价指标。准确率(Accuracy)表示分类模型所有判断正确的结果占总观测值的比重;精确率(Precision)表示模型观测是Positive的所有结果中,模型预测对的比重;召回率(Recall)表示真实值是Positive的所有结果中,模型预测对的比重;F1分数综合了Precision和Recall的结果,是精确率和召回率的调和平均数,取值越高,模型效果越好.
models = pd.DataFrame({

    'Model': ['KNN', 'Logistic Regression',
              'Random Forest', 'Naive Bayes',
              'Stochastic Gradient Decent', 'Linear SVC',
              'Decision Tree', 'Gradient Boosting Trees',
              'AdaBoost', 'Voting'],
    'Acc': [
        acc_knn, acc_log, acc_rf,
        acc_gaussian, acc_sgd,
        acc_linear_svc, acc_dt,
        acc_gbt, acc_adb, acc_vot
    ],
    'Acc_cv': [
        acc_cv_knn, acc_cv_log,
        acc_cv_rf, acc_cv_gaussian,
        acc_cv_sgd, acc_cv_linear_svc,
        acc_cv_dt, acc_cv_gbt,
        acc_cv_adb, acc_cv_vot
    ],
    'precision': [
        round(precision_score(y_test,test_pred_knn), 3),
        round(precision_score(y_test,test_pred_log), 3),
        round(precision_score(y_test,test_pred_rf), 3),
        round(precision_score(y_test,test_pred_gaussian), 3),
        round(precision_score(y_test,test_pred_sgd), 3),
        round(precision_score(y_test,test_pred_svc), 3),
        round(precision_score(y_test,test_pred_dt), 3),
        round(precision_score(y_test,test_pred_gbt), 3),
        round(precision_score(y_test,test_pred_adb), 3),
        round(precision_score(y_test,test_pred_vot), 3),
    ],
    'recall': [
        round(recall_score(y_test,test_pred_knn), 3),
        round(recall_score(y_test,test_pred_log), 3),
        round(recall_score(y_test,test_pred_rf), 3),
        round(recall_score(y_test,test_pred_gaussian), 3),
        round(recall_score(y_test,test_pred_sgd), 3),
        round(recall_score(y_test,test_pred_svc), 3),
        round(recall_score(y_test,test_pred_dt), 3),
        round(recall_score(y_test,test_pred_gbt), 3),
        round(recall_score(y_test,test_pred_adb), 3),
        round(recall_score(y_test,test_pred_vot), 3),
    ],
    'F1': [
        round(f1_score(y_test,test_pred_knn,average='binary'), 3),
        round(f1_score(y_test,test_pred_log,average='binary'), 3),
        round(f1_score(y_test,test_pred_rf,average='binary'), 3),
        round(f1_score(y_test,test_pred_gaussian,average='binary'), 3),
        round(f1_score(y_test,test_pred_sgd,average='binary'), 3),
        round(f1_score(y_test,test_pred_svc,average='binary'), 3),
        round(f1_score(y_test,test_pred_dt,average='binary'), 3),
        round(f1_score(y_test,test_pred_gbt,average='binary'), 3),
        round(f1_score(y_test,test_pred_adb,average='binary'), 3),
        round(f1_score(y_test,test_pred_vot,average='binary'), 3),
    ],
})
models.sort_values(by='Acc', ascending=False)
得到各模型评价参数如下表所示:
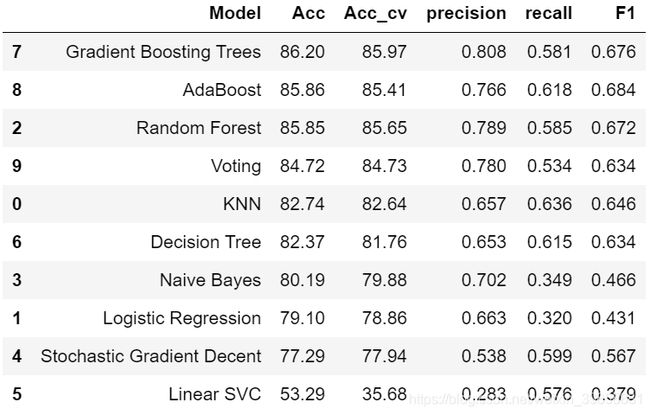
从上表可见,本文所用到的十个模型中,梯度提升决策树(Gradient Boosting Trees)、AdaBoost、随机森林(Random Forest)三个模型的准确率均表现良好,达到了85%以上,F1值相较于其他模型也处于较为优秀的水平,故从指标角度来看,这三个模型更适用于本文所研究的问题。
5.2 ROC曲线
ROC曲线全称Receiver Operating Characteristic Curve,即接受者操作特征曲线,ROC曲线越接近左上角,其对应模型的分类效果越好。参数AUC(Area Under Curve)代表了ROC曲线下的面积,能够定量地衡量分类器的好坏,AUC值越大,模型表现效果越好[10]。
plt.style.use('seaborn-whitegrid')
fig = plt.figure(figsize=(10,10))
models = [
    'KNN',
    'Logistic Regression',
    'Random Forest',
    'Naive Bayes',
    'Decision Tree',
    'Gradient Boosting Trees',
    'AdaBoost',
    'Linear SVC',
    'Voting',
    'Stochastic Gradient Decent'
]
probs = [
    probs_knn,
    probs_log,
    probs_rf,
    probs_gau,
    probs_dt,
    probs_gbt,
    probs_adb,
    probs_svc,
    probs_vot,
    probs_sgd
]
colormap = plt.cm.tab10 #nipy_spectral, Set1, Paired, tab10, gist_ncar
colors = [colormap(i) for i in np.linspace(0, 1,len(models))]
plt.title('Receiver Operating Characteristic')
plt.plot([0, 1], [0, 1],'r--')
plt.xlim([-0.01, 1.01])
plt.ylim([-0.01, 1.01])
plt.ylabel('True Positive Rate')
plt.xlabel('False Positive Rate')
def plot_roc_curves(y_test, prob, model):
    fpr, tpr, threshold = metrics.roc_curve(y_test, prob)
    roc_auc = metrics.auc(fpr, tpr)
    label = model + ' AUC = %0.2f' % roc_auc
    plt.plot(fpr, tpr, 'b', label=label, color=colors[i])
    plt.legend(loc = 'lower right')
for i, model in list(enumerate(models)):
    plot_roc_curves(y_test, probs[i], models[i])
将本文所用的10个模型的ROC曲线汇集到一张表上如下:
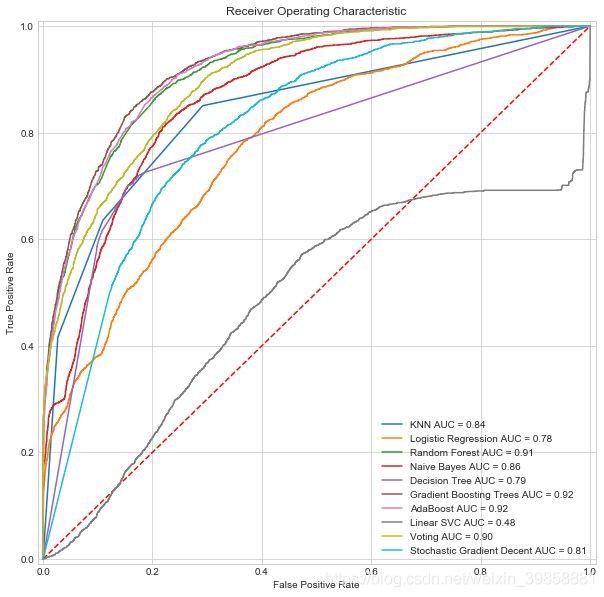
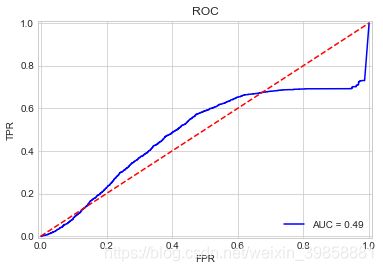
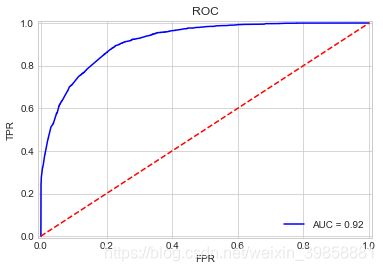
通过观察图像和对比AUC值,本文中梯度提升决策树(Gradient Boosting Trees)和AdaBoost两个模型表现最优,AUC值均达到了0.92,线性支持向量机模型表现最差,几乎无法起到有效的分类作用。
5.3 P-R曲线
P-R曲线是比较分类器的一个有效的工具,P-R曲线越靠近图像右上角的分类器表现越好,若一个分类器的P-R曲线被另一个分类器的P-R曲线完全“包住”,则后者的性能优于前者[11]。
# 构建绘制P-R曲线方法
fig = plt.figure(figsize=(10,10))
plt.xlabel('Recall')
plt.ylabel('Precision')
plt.ylim([0.0, 1.05])
plt.xlim([0.0, 1.0])
plt.title('2-class Precision-Recall Curve')
colormap = plt.cm.Set1 #nipy_spectral, Set1, Paired, gist_ncar
colors = [colormap(i) for i in np.linspace(0, 1,len(models))]
def plot_pr_curve_overall(y_test, probs, model):
    precision, recall, _ = precision_recall_curve(y_test, probs)
    label = (model + ' AP={0:0.2f}'.format(average_precision_score(y_test, probs)))
    plt.step(recall, precision, color=colors[i],
             where='post', label=label)
#     plt.fill_between(recall, precision, step='post', alpha=0.2, color=colors[i])
    plt.legend(bbox_to_anchor=(1.05, 0), loc=3, borderaxespad=0)
for i, model in list(enumerate(models)):
    plot_pr_curve_overall(y_test, probs[i], models[i])
绘制出的P-R曲线如下图所示。
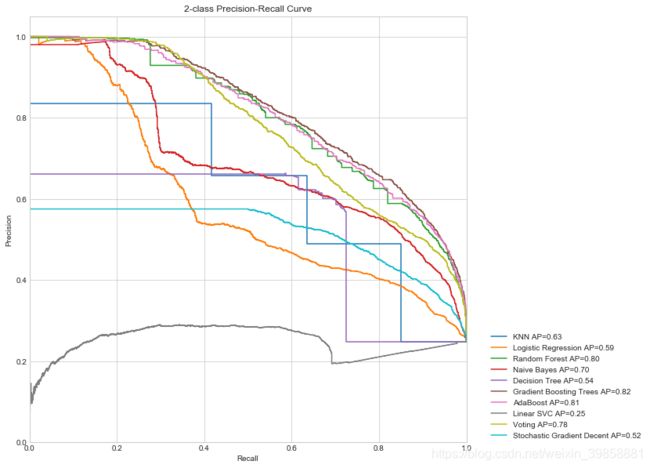
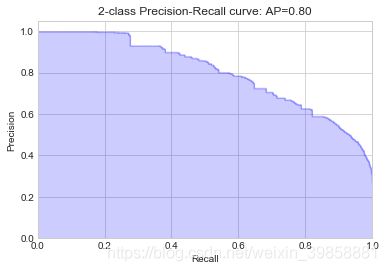
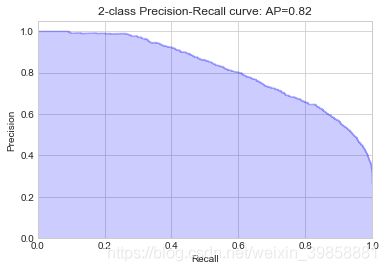
从P-R曲线可以看出,梯度提升决策树分类器的表现效果最好,其次为AdaBoost和随机森林,与ROC曲线和观察相关评价指标得出的结果大致一致。
参考文献
[1] Agarwal A, Saxena A. Malignant Tumor Detection Using Machine Learning through Scikit-learn[J]. International Journal of Pure and Applied Mathematics, 2018, 119(15): 2863-2874.
[2] Kohavi R. Scaling up the accuracy of naive-bayes classifiers: A decision-tree hybrid[C]//Kdd. 1996, 96: 202-207.
[3] Deepajothi S, Selvarajan S. A comparative study of classification techniques on adult data set[J]. International Journal of Engineering Research and Technology, 2012, 1(8): 1-8.
[4] Mangasarian O L, Musicant D R. Successive overrelaxation for support vector machines[J]. IEEE Transactions on Neural Networks, 1999, 10(5): 1032-1037.
[5] Pedregosa F, Varoquaux G, Gramfort A, et al. Scikit-learn: Machine learning in Python[J]. Journal of machine learning research, 2011, 12(Oct): 2825-2830.
[6] Abraham A, Pedregosa F, Eickenberg M, et al. Machine learning for neuroimaging with scikit-learn[J]. Frontiers in neuroinformatics, 2014, 8: 14.
[7] Buitinck L, Louppe G, Blondel M, et al. API design for machine learning software: experiences from the scikit-learn project[J]. arXiv preprint arXiv:1309.0238, 2013.
[8] Paper D, Paper D. Scikit-Learn Classifier Tuning from Simple Training Sets[J]. Hands-on Scikit-Learn for Machine Learning Applications: Data Science Fundamentals with Python, 2020: 137-163.
[9] Powers D M. Evaluation: from precision, recall and F-measure to ROC, informedness, markedness and correlation[J]. 2011.
[10] Rosset S. Model selection via the AUC[C]//Proceedings of the twenty-first international conference on Machine learning. 2004: 89.
[11] Boyd K, Eng K H, Page C D. Area under the precision-recall curve: point estimates and confidence intervals[C]//Joint European conference on machine learning and knowledge discovery in databases. Springer, Berlin, Heidelberg, 2013: 451-466.


