【python绘图】Matplotlib绘图及设置(使用python制图)
目录
一、初识matplotlib.pyplot
1.绘制图像
2.设置图片大小
3.保存图片文件
4.设置X,Y轴刻度范围
自定义刻度内容
5.添加描述信息(标题、轴标签)
6.设置显示中文(导入字体模块)
7.绘制网格
绘制一个温度随时间变化的折线图实例
二、常见绘图属性设置
1.绘图符号(Makers)
2.线型(Line Styles)
3.颜色缩写(Colors)
4.Windows字体中英文名称对照
面向对象方式绘图
配置对象的属性
绘制多个子图
三、Artist对象
Artist对象进行绘图的流程
设置Artist属性
一些例子
Figure容器
坐标轴刻度设置
# matplotlib提供快速绘图模块pyplot,它模仿了MATLAB的部分功能
import matplotlib.pyplot as plt #导入绘图模块
from matplotlib import pyplot as plt #两种导入方法都可
第一节内容的精简版总结:
- 绘制折线图(plt.plot)
- 设置图片大小和分辨率(plt.figure)
- 保存图片到本地(plt.savefig)
- 设置xy轴刻度和字符串(xticks、yticks)
- 设置标题、xy轴标签(title、xlable、ylable)
- 设置字体(font_manager.fontProperties,matplotlib.rc)
- 同一张图绘制多线条(plt多次plot)
- 添加图例、绘制网格
- 其他图像类型(散点图plt.scatter,条形图plt.bar,横向plt.barh,直方图plt.hist(bin.width组距、num_bins分多少组、))
一、初识matplotlib.pyplot
准备好制图数据,传入参数。即可使用plt.plot(参数)、plt.show()一键出图!
import matplotlib.pyplot as plt
x = [......]
y = [......]
plt.plot(x,y,label='图例') #绘图,并且标注图例
plt.show() #显示
plot.legend(prop=my_font) #设置显示图例,括号中意思为显示中文(后面讲解)
1.绘制图像
plt.plot() 参数设置:
color=’ ‘ 线条颜色
linestyle=’‘ 线条风格
linewidth= 线条粗细
alpha=0.5 透明度 (对照表见常见绘图属性设置附表)
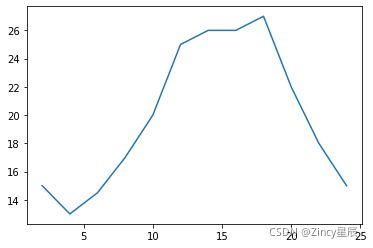
一个实例:假设一天中每隔两个小时(range(2,26,2))的气温(℃)分别是[15,13,14.5,17,20,25,26,26,27,22,18,15]
import matplotlib.pyplot as plt

x = range(2,26,2)
y = [15,13,14.5,17,20,25,26,26,27,22,18,15]

# 绘图
plt.plot(x,y)
# 显示
plt.show()2.设置图片大小
在绘制图片之前,使用plt.figure函数设置图片大小,其中figsize为元组,分别代表长宽,dpi(Dot Per Inch)为分辨率表示的单位之一。
plt.figure(figsize=(20,8),dpi=150) #图片大小为20*8,每英寸150个像素点
3.保存图片文件
plt.savefig("./t1.png") #将图片保存到本地
引号里为文件路径和文件名( ./ 代表当前路径,png为文件后缀/格式)
4.设置X,Y轴刻度范围
设置x,y轴的范围可以使用多种方法
plt.xticks(x) # 将x里的值作为刻度
plt.xticks(range(2,25)) #传入range数列
plt.yticks(range(min(y),max(y)+1)) #传入最小到最大值数列
_xticks_lables = [i/2 for i in range(4,49)] # 生成更复杂的数列
plt.xticks(_xticks_lables[::3]) #取步长作为刻度
自定义刻度内容
_x =list(x) [::3]
_xticks_labels = ["10点{ }分".format(i) for i in _x]
plt.xticks(_x,_xticks_labels) #分别代表刻度范围和刻度内容
5.添加描述信息(标题、轴标签)
plt.title("折线图") #设置标题
plt.xlabel("时间") #设置x轴标注
plt.ylabel("气温") #设置y轴标注
6.设置显示中文(导入字体模块)
from matplotlib import font_manager #导入字体管理模块
my_font = font_manager.FontProperties(fname="C:/WINDOWS/Fonts/STSONG.TTF")
#定义中文字体属性,文字储存路径可以在C:/WINDOWS/Fonts/找到,这里设置为宋体
plt.xlabel("时间",fontproperties = my_font,fontsize = 18)
#在设置x坐标中文标注,令fontproperties = my_font,fontsize令字体为18号
#plt.title,plt.ylabel,plt.xticks,plt.yticks设置中文标注类似
7.绘制网格
plt.grid(alpha=0.4)
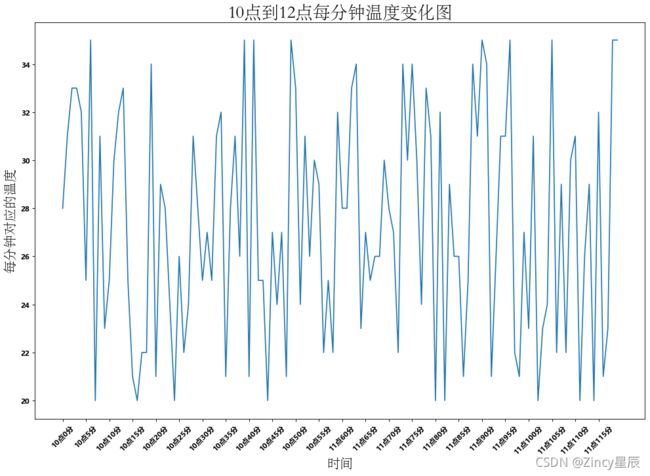
绘制一个温度随时间变化的折线图实例
import matplotlib.pyplot as plt
import random    #导入随机生成模块
from matplotlib import font_manager#导入字体管理模块
my_font = font_manager.FontProperties(fname="C:/WINDOWS/Fonts/STSONG.TTF")
#定义中文字体属性,文字储存路径可以在C:/WINDOWS/Fonts/找到,本次设置为宋体

x = range(0,120)    #x值为0-120
y = [random.randint(20,35) for i in range(120)]     #y值为120个在20-35之间的随机数

plt.figure(figsize=(15,10),dpi = 80)    #图片大小为15*10,每英寸80个像素点

'''调整x轴刻度'''
_xticks_labels = ["10点{}分".format(i) for i in range(60)]
_xticks_labels += ["11点{}分".format(i) for i in range(60,120)]
plt.xticks(list(x)[::5],_xticks_labels[::5],rotation=45)    #rotation旋转度数
#取步长5,数字和字符串一一对应,保证数据的长度一样

'''设置标注'''
plt.title("10点到12点每分钟温度变化图",fontproperties = my_font,fontsize = 24)    #设置标题
plt.xlabel("时间",fontproperties = my_font,fontsize = 18)    #设置x坐标标注,字体为18号
plt.ylabel("每分钟对应的温度",fontproperties = my_font,fontsize = 18)    #设置y坐标标注

plt.plot(x,y)   #绘图
plt.show()  #显示
二、常见绘图属性设置
1.绘图符号(Makers)
| 符号 |
中文说明 |
英文说明 |
| '.' |
圆点 |
point marker |
| ',' |
像素点 |
pixel marker |
| 'o' |
圆圈 |
circle marker |
| 'v' |
向下三角形 |
triangle_down marker |
| '^' |
向上三角形 |
triangle_up marker |
| '<' |
向左三角形 |
triangle_left marker |
| '>' |
向右三角形 |
triangle_right marker |
| '1' |
向下Y形 |
tri_down marker |
| '2' |
向上Y形 |
tri_up marker |
| '3' |
向左Y形 |
tri_left marker |
| '4' |
向右Y形 |
tri_right marker |
| 's' |
方形 |
square marker |
| 'p' |
五边形 |
pentagon marker |
| '*' |
星形 |
star marker |
| 'h' |
六角形1 |
hexagon1 marker |
| 'H' |
六角形2 |
hexagon2 marker |
| '+' |
加号 |
plus marker |
| 'x' |
叉号 |
x marker |
| 'D' |
钻石形 |
diamond marker |
| 'd' |
钻石形(小) |
thin_diamond marker |
| '|' |
竖线 |
vline marker |
| '_' |
横线 |
hline marker |
2.线型(Line Styles)
| 符号 |
中文说明 |
英文说明 |
| '-' |
实线 |
solid line style |
| '--' |
虚线 |
dashed line style |
| '-.' |
点划线 |
dash-dot line style |
| ':' |
点线 |
dotted line style |
3.颜色缩写(Colors)
多种丰富的颜色对照代码参见:RGB颜色值与十六进制颜色码转换工具 (sioe.cn)
| 符号 |
中文说明 |
英文说明 |
| 'b' |
蓝 |
blue |
| 'g' |
绿 |
green |
| 'r' |
红 |
red |
| 'c' |
青 |
cyan |
| 'm' |
紫 |
magenta |
| 'y' |
黄 |
yellow |
| 'k' |
黑 |
black |
| 'w' |
白 |
white |
4.Windows字体中英文名称对照
| 中文名称 |
英文名称 |
| 黑体 |
SimHei |
| 微软雅黑 |
Microsoft YaHei |
| 微软正黑体 |
Microsoft JhengHei |
| 新宋体 |
NSimSun |
| 新细明体 |
PMingLiU |
| 细明体 |
MingLiU |
| 标楷体 |
DFKai-SB |
| 仿宋 |
FangSong |
| 楷体 |
KaiTi |
| 仿宋_GB2312 |
FangSong_GB2312 |
| 楷体_GB2312 |
KaiTi_GB2312 |
面向对象方式绘图
- matplotlib是一套面向对象的绘图库,图中的所有部件都是python对象。
- pyplot是matplotlib仿照MATLAB提供的一套快速绘图API,它并不是matplotlib本体。
- pyplot虽然用起来简单快捷,但它隐藏了大量的细节,不能使用一些高级功能。
- pyplot模块内部保存了当前图表和当前子图等信息,可以分别用gcf()和gca()获得这两个对象:
plt.gcf(): "Get current figure"获取当前图表(Figure对象)
plt.gca(): "Get current figure"获取当前子图(Axes对象)
- pyplot中的各种绘图函数,实际上是在内部调用gca获取当前Axes对象,然后调用Axes的方法完成绘图的。
import matplotlib.pyplot as plt
# 获取当前的Figure和Axes对象
plt.figure(figsize=(4,3))
fig = plt.gcf()
axes = plt.gca()
print(fig)
print(axes)
配置对象的属性
- matplotlib所绘制的图表的每一部分都对应一个对象,有两种方式设置这些对象的属性:
通过对象的set_*()方法设置。
通过pyplot的setp()方法设置。
- 同样也有两种方法查看对象的属性:
通过对象的get_*()方法查看。
通过pyplot的getp()方法查看。
import matplotlib.pyplot as plt
import numpy as np
# 获取当前的Figure和Axes对象
plt.figure(figsize=(4,3))
fig = plt.gcf() ; axes = plt.gca()
print(fig); print(axes)
x = np.arange(0, 5, 0.1)
# 调用plt.plot函数,返回一个Line2D对象列表
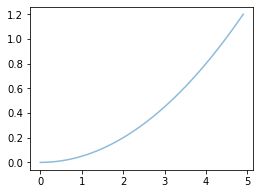
lines = plt.plot(x, 0.05*x*x); print(lines)
# 调用Line2D对象的set系列方法设置属性值
# 用set_alpha设置alpha通道,也就是透明度
lines[0].set_alpha(0.5) ; plt.show()
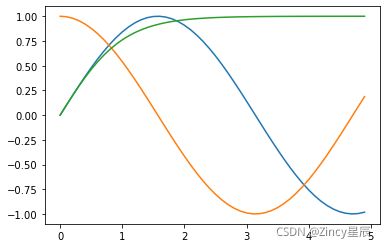
# plt.plot函数可以接受不定个数的位置参数,这些位置参数两两配对,生成多条曲线。
lines = plt.plot(x, np.sin(x), x, np.cos(x), x, np.tanh(x))
plt.show()
# 使用plt.setp函数同时配置多个对象的属性,这里设置lines列表中所有曲线的颜色和线宽。
plt.setp(lines, color='r', linewidth=4.0);plt.show()
# 使用getp方法查看所有的属性
f = plt.gcf(); plt.getp(f)
import numpy as np
import matplotlib.pyplot as plt
# 获取当前的Figure和Axes对象
plt.figure(figsize=(4,3))
fig = plt.gcf() ; axes = plt.gca()
print(fig); print(axes)
x = np.arange(0, 5, 0.1)
# 调用plt.plot函数,返回一个Line2D对象列表
lines = plt.plot(x, 0.05*x*x); print(lines)
# 调用Line2D对象的set系列方法设置属性值
# 用set_alpha设置alpha通道,也就是透明度
lines[0].set_alpha(0.5) ; plt.show()
# plt.plot函数可以接受不定个数的位置参数,这些位置参数两两配对,生成多条曲线。
lines = plt.plot(x, np.sin(x), x, np.cos(x), x, np.tanh(x))
plt.show()
# 使用plt.setp函数同时配置多个对象的属性,这里设置lines列表中所有曲线的颜色和线宽。
plt.setp(lines, color='r', linewidth=4.0);plt.show()
# 使用getp方法查看所有的属性
f = plt.gcf(); plt.getp(f)
# 查看某个属性
print(plt.getp(lines[0],"color"))
# 使用对象的get_*()方法
print(lines[0].get_linewidth())
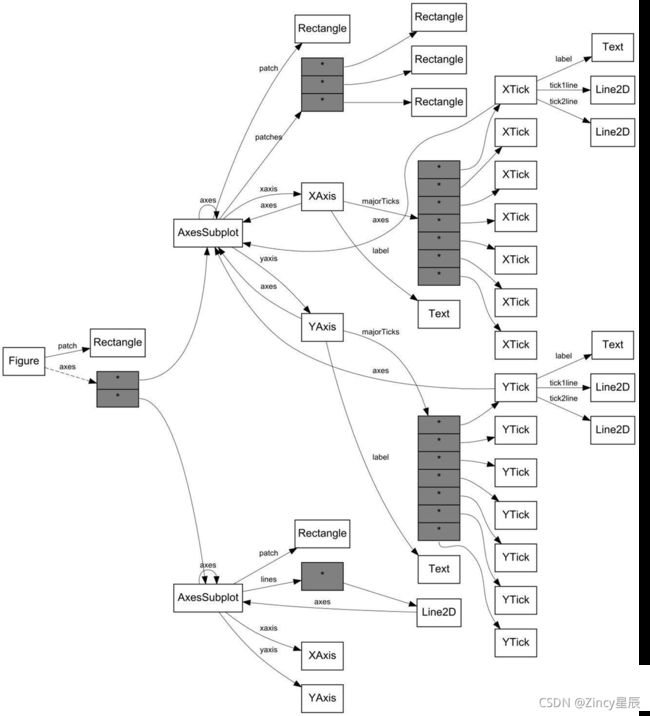
# Figure对象的axes属性是一个列表,存储该Figure中的所有Axes对象。
# 下面代码查看当前Figure的axes属性,也就是gca获得的当前Axes对象。
print(plt.getp(f, 'axes'))
print(len(plt.getp(f, 'axes')))
print(plt.getp(f, 'axes')[0] is plt.gca())
# 用plt.getp()可以继续获取AxesSubplot对象的属性,例如它的lines属性为子图中的Line2D对象列表。
# 通过这种方法可以查看对象的属性值,以及各个对象之间的关系。
all_lines = plt.getp(plt.gca(), "lines");print(all_lines)
plt.close() # 关闭当前图表
绘制多个子图
- 在matplotlib中,一个Figure对象可以包括多个Axes对象(也就是子图),一个Axes代表一个绘图区域。最简单的多子图绘制方式是使用pyplot的subplot函数。
- subplot(numRows, numCols, plotNum)接受三个参数:
numRows:子图行数
numCols:子图列数
plotNum:第几个子图(按从左到右,从上到下的顺序编号)
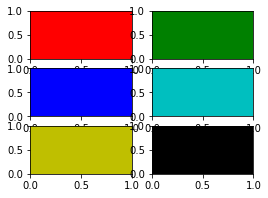
import matplotlib.pyplot as plt
# 创建3行2列,共计6个子图。
# subplot(323)等价于subplot(3,2,3)。
# 子图的编号是从1开始,不是从0开始。
fig = plt.figure(figsize=(4,3))
for idx,color in enumerate('rgbcyk'):
    plt.subplot(321+idx, facecolor=color)
plt.show()
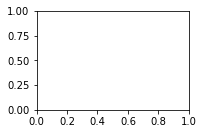
# 如果新创建的子图和之前创建的有重叠区域,则之前的子图会被删除
plt.subplot(221)
plt.show()
plt.close()
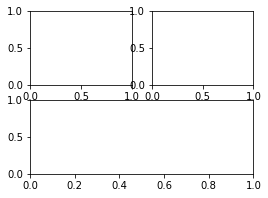
# 还可以用多个高度或宽度不同的子图相互拼接
fig = plt.figure(figsize=(4,3))
plt.subplot(221) # 第一行左图
plt.subplot(222) # 第一行右图
plt.subplot(212) # 第二行整行
plt.show()
plt.close()三、Artist对象
简单类型的Artist对象是标准的绘图元件,例如Line2D,Rectangle,Text,AxesImage等
容器类型的Artist对象包含多个Artist对象使他们组织成一个整体例如Axis,Axes,Figure对象
Artist对象进行绘图的流程
- 创建Figure对象
- 为Figure对象创建一个或多个Axes对象
- 调用Axes对象的方法来创建各种简单的Artist对象
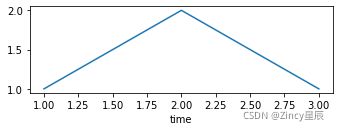
import matplotlib.pyplot as plt
fig = plt.figure()
# 列表用于描述图片所在的位置以及图片的大小
ax = fig.add_axes([0.15, 0.1, 0.7, 0.3])
ax.set_xlabel('time')
line = ax.plot([1, 2, 3], [1, 2, 1])[0]
# ax的lines属性是一个包含所有曲线的列表
print(line is ax.lines[0])
# 通过get_*获得相应的属性
print(ax.get_xaxis().get_label().get_text())
plt.show()设置Artist属性
get_* 和 set_* 函数进行读写fig.set_alpha(0.5*fig.get_alpha())
| Artist 属性 |
作用 |
| alpha |
透明度,值在0到1之间,0为完全透明,1为完全不透明 |
| animated |
布尔值,在绘制动画效果时使用 |
| axes |
此Artist对象所在的Axes对象,可能为None |
| clip_box |
对象的裁剪框 |
| clip_on |
是否裁剪 |
| clip_path |
裁剪的路径 |
| contains |
判断指定点是否在对象上的函数 |
| figure |
所在的Figure对象,可能为None |
| label |
文本标签 |
| picker |
控制Artist对象选取 |
| transform |
控制偏移旋转 |
| visible |
是否可见 |
| zorder |
控制绘图顺序 |
一些例子
import matplotlib.pyplot as plt
fig = plt.figure()
# 设置背景色
fig.patch.set_color('g')
# 必须更新界面才会有效果
fig.canvas.draw()
plt.show()
# artist对象的所有属性都可以通过相应的get_*()和set_*()进行读写
# 例如设置下面图像的透明度
line = plt.plot([1, 2, 3, 2, 1], lw=4)[0]
line.set_alpha(0.5)
line.set(alpha=0.5, zorder=1)
# fig.canvas.draw()
# 输出Artist对象的所有属性名以及与之对应的值
print(fig.patch)
plt.show()
import matplotlib.pyplot as plt
fig = plt.figure()
fig.subplots_adjust(top=0.8)
ax1 = fig.add_subplot(211)
ax1.set_ylabel('volts')
ax1.set_title('a sine wave')
t = np.arange(0.0, 1.0, 0.01)
s = np.sin(2*np.pi*t)
line, = ax1.plot(t, s, color='blue', lw=2)
# Fixing random state for reproducibility
np.random.seed(19680801)
ax2 = fig.add_axes([0.15, 0.1, 0.7, 0.3])
n, bins, patches = ax2.hist(np.random.randn(1000), 50,
facecolor='yellow', edgecolor='orange')
ax2.set_xlabel('time (s)')
plt.show()Figure容器
最上层的Artist对象是Figure,包含组成图表的所有元素
Figure可以包涵多个Axes(多个图表),创建主要有三种方法:
- axes = fig.add_axes([left, bottom, width, height])
- fig, axes = plt.subplots(行数, 列数)
- axes = fig.add_subplot(行数, 列数, 序号)
| Figure 属性 |
说明 |
| axes |
Axes对象列表 |
| patch |
作为背景的Rectangle对象 |
| images |
FigureImage对象列表,用来显示图片 |
| legends |
Legend对象列表 |
| lines |
Line2D对象列表 |
| patches |
patch对象列表 |
| texts |
Text对象列表,用来显示文字 |
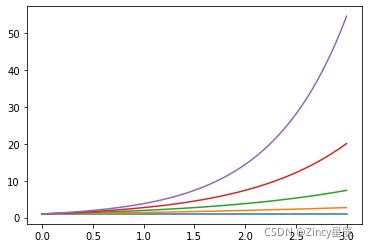
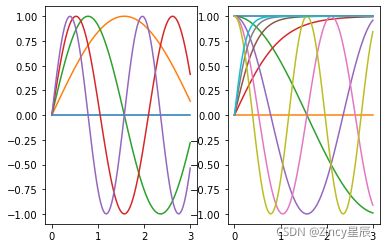
import matplotlib.pyplot as plt
# 下面请看一个多Figure,多Axes,互相灵活切换的例子。
plt.figure(1) # 创建图表1
plt.figure(2) # 创建图表2
ax1 = plt.subplot(121) # 在图表2中创建子图1
ax2 = plt.subplot(122) # 在图表2中创建子图2
x = np.linspace(0, 3, 100)
for i in range(5):
    plt.figure(1) # 切换到图表1
    plt.plot(x, np.exp(i*x/3))
    plt.sca(ax1) # 选择图表2的子图1
    plt.plot(x, np.sin(i*x))
    plt.sca(ax2) # 选择图表2的子图2
    plt.plot(x, np.cos(i*x))
    ax2.plot(x, np.tanh(i*x)) # 也可以通过ax2的plot方法直接绘图
plt.show()
plt.close() # 打开了两个Figure对象,因此要执行plt.close()两次
plt.close()
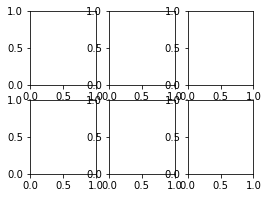
# 还可以使用subplots函数,一次生成多个子图,并返回Figure对象和Axes对象数组。
# 注意subplot和subplots两个函数差一个s,前者是逐个生成子图,后者是批量生成。
fig, axes = plt.subplots(2, 3, figsize=(4,3))
[a,b,c],[d,e,f] = axes
print(axes.shape)
print(b)
plt.show()
plt.close()
Axes容器
- 图像的区域,有数据空间(标记为内部蓝色框)
- 图形可以包含多个 Axes,轴对象只能包含一个图形
- Axes 包含两个(或三个)Axis对象,负责数据限制
- 每个轴都有一个标题(通过set_title()设置)、一个x标签(通过set_xLabel()设置)和一个通过set_yLabel()设置的y标签集。
| Axes 属性 |
说明 |
| artists |
A list of Artist instances |
| patch |
Rectangle instance for Axes background |
| collections |
A list of Collection instances |
| images |
A list of AxesImage |
| legends |
A list of Legend instances |
| lines |
A list of Line2D instances |
| patches |
A list of Patch instances |
| texts |
A list of Text instances |
| xaxis |
matplotlib.axis.XAxis instance |
| yaxis |
matplotlib.axis.YAxis instance |
| Axes的方法(Helper method) |
所创建的对象(Artist ) |
添加进的列表(Container) |
| ax.annotate - text annotations |
Annotate |
ax.texts |
| ax.bar - bar charts |
Rectangle |
ax.patches |
| ax.errorbar - error bar plots |
Line2D and Rectangle |
ax.lines and ax.patches |
| ax.fill - shared area |
Polygon |
ax.patches |
| ax.hist - histograms |
Rectangle |
ax.patches |
| ax.imshow - image data |
AxesImage |
ax.images |
| ax.legend - axes legends |
Legend |
ax.legends |
| ax.plot - xy plots |
Line2D |
ax.lines |
| ax.scatter - scatter charts |
PolygonCollection |
ax.collections |
| ax.text - text |
Text |
ax.texts |
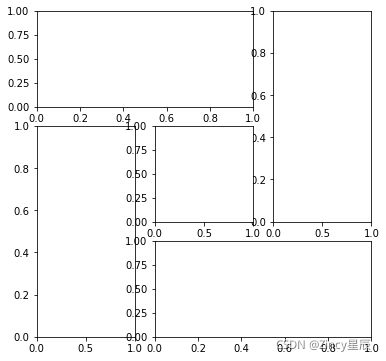
subplot2grid函数进行更复杂的布局。subplot2grid(shape, loc, rowspan=1, colspan=1, **kwargs)
- shape为表示表格形状的元组(行数,列数)
- loc为子图左上角所在的坐标元组(行,列)
- rowspan和colspan分别为子图所占据的行数和列数
import matplotlib.pyplot as plt
fig = plt.figure(figsize=(6,6))
ax1 = plt.subplot2grid((3,3),(0,0),colspan=2)
ax2 = plt.subplot2grid((3,3),(0,2),rowspan=2)
ax3 = plt.subplot2grid((3,3),(1,0),rowspan=2)
ax4 = plt.subplot2grid((3,3),(2,1),colspan=2)
ax5 = plt.subplot2grid((3,3),(1,1))
plt.show()
plt.close()
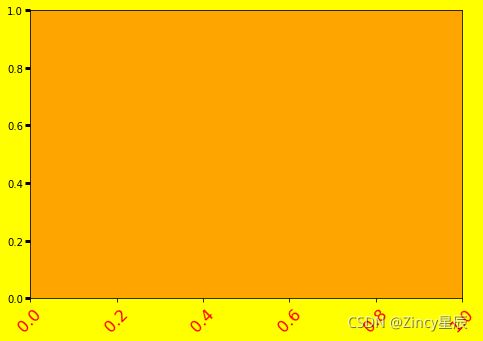
坐标轴上的刻度线、刻度文本、坐标网格及坐标轴标题等
set_major_* set_minor_*
get_major_* get_minor_*
import numpy as np
import matplotlib.pyplot as plt
# plt.figure creates a matplotlib.figure.Figure instance
fig = plt.figure()
rect = fig.patch # a rectangle instance
rect.set_facecolor('yellow')
ax1 = fig.add_axes([0.1, 0.3, 1,1])
rect = ax1.patch
rect.set_facecolor('orange')
for label in ax1.xaxis.get_ticklabels():
    # label is a Text instance
    label.set_color('red')
    label.set_rotation(45)
    label.set_fontsize(16)
for line in ax1.yaxis.get_ticklines():
    # line is a Line2D instance
    line.set_color('green')
    line.set_markersize(5)
    line.set_markeredgewidth(3)
plt.show()
坐标轴刻度设置
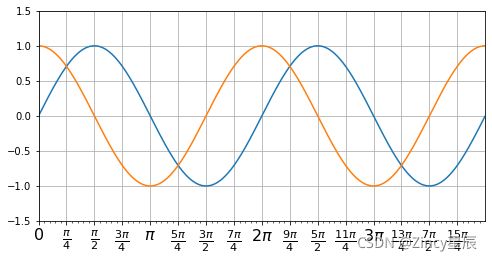
matplotlib会按照用户所绘制的图的数据范围自动计算,但有的时候也需要我们自定义。
我们有时候希望将坐标轴的文字改为我们希望的样子,比如特殊符号,年月日等。
# 修改坐标轴刻度的例子
# 配置X轴的刻度线的位置和文本,并开启副刻度线
# 导入fractions包,处理分数
import numpy as np
import matplotlib.pyplot as plt
from fractions import Fraction
# 导入ticker,刻度定义和文本格式化都在ticker中定义
from matplotlib.ticker import MultipleLocator, FuncFormatter
x = np.arange(0, 4*np.pi, 0.01)
fig, ax = plt.subplots(figsize=(8,4))
plt.plot(x, np.sin(x), x, np.cos(x))
# 定义pi_formatter, 用于计算刻度文本
# 将数值x转换为字符串,字符串中使用Latex表示数学公式。
def pi_formatter(x, pos):
    frac = Fraction(int(np.round(x / (np.pi/4))), 4)
    d, n = frac.denominator, frac.numerator
    if frac == 0:
        return "0"
    elif frac == 1:
        return "$\pi$"
    elif d == 1:
        return r"${%d} \pi$" % n
    elif n == 1:
        return r"$\frac{\pi}{%d}$" % d
    return r"$\frac{%d \pi}{%d}$" % (n, d)
# 设置两个坐标轴的范围
plt.ylim(-1.5,1.5)
plt.xlim(0, np.max(x))
# 设置图的底边距
plt.subplots_adjust(bottom = 0.15)
plt.grid() #开启网格
# 主刻度为pi/4
# 用MultipleLocator以指定数值的整数倍放置刻度线
ax.xaxis.set_major_locator( MultipleLocator(np.pi/4) )
# 主刻度文本用pi_formatter函数计算
# 使用指定的函数计算刻度文本,这里使用我们刚刚编写的pi_formatter函数
ax.xaxis.set_major_formatter( FuncFormatter( pi_formatter ) )
# 副刻度为pi/20
ax.xaxis.set_minor_locator( MultipleLocator(np.pi/20) )
# 设置刻度文本的大小
for tick in ax.xaxis.get_major_ticks():
    tick.label1.set_fontsize(16)
plt.show()
plt.close()
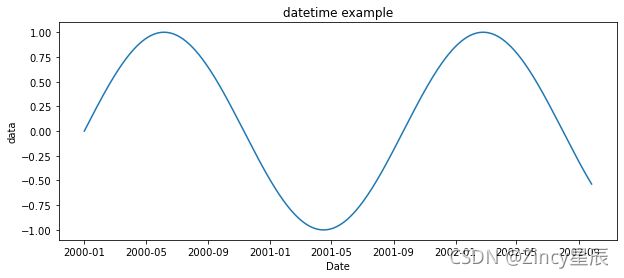
import datetime
import numpy as np
import matplotlib.pyplot as plt
# 准备数据
x = np.arange(0,10,0.01)
y = np.sin(x)
# 将数据转换为datetime对象列表
date_list = []
date_start = datetime.datetime(2000,1,1,0,0,0)
delta = datetime.timedelta(days=1)
for i in range(len(x)):
date_list.append(date_start + i*delta)
# 绘图,将date_list作为x轴数据,当作参数传递
fig, ax = plt.subplots(figsize=(10,4))
plt.plot(date_list, y)
# 设定标题
plt.title('datetime example')
plt.ylabel('data')
plt.xlabel('Date')
plt.show()
plt.close()如果数据中本来就有时间日期信息,可以使用strptime和strftime直接转换。
使用strptime函数将字符串转换为time,使用strftime将time转换为字符串。
python中的时间日期格式化符号:
| 符号 |
意义 |
| %y |
两位数的年份表示(00-99) |
| %Y |
四位数的年份表示(000-9999) |
| %m |
月份(01-12) |
| %d |
月内中的一天(0-31) |
| %H |
24小时制小时数(0-23) |
| %I |
12小时制小时数(01-12) |
| %M |
分钟数(00=59) |
| %S |
秒(00-59) |
| %a |
本地简化星期名称 |
| %A |
本地完整星期名称 |
| %b |
本地简化的月份名称 |
| %B |
本地完整的月份名称 |
| %c |
本地相应的日期表示和时间表示 |
| %j |
年内的一天(001-366) |
| %p |
本地A.M.或P.M.的等价符 |
| %U |
一年中的星期数(00-53)星期天为星期的开始 |
| %w |
星期(0-6),星期天为星期的开始 |
| %W |
一年中的星期数(00-53)星期一为星期的开始 |
| %x |
本地相应的日期表示 |
| %X |
本地相应的时间表示 |
| %Z |
当前时区的名称 |
| %% |
%号本身 |
