镜像设置
- CRAN的镜像不能下载Bioconductor的包
CRAN是R默认使用的R包仓库,install.packages()只能用于安装发布在CRAN上的包。此外还有几个软件包仓库,而Bioconductor是基因组数据分析相关的软件包仓库,需要用专门的命令进行安装。BiocManager::install()是最新版本的R和 Bioconductor安装Bioconductor 软件包的命令
作者:atuofatating
链接:https://www.jianshu.com/p/8e0dece51757
来源:
- options()$repos#检验是否从cran镜像下载R包
options("repos" = c(CRAN="https://mirrors.tuna.tsinghua.edu.cn/CRAN/"))
- options()$BioC_mirror #检验是否从bioconductor下载R
options(BioC_mirror="https://mirrors.ustc.edu.cn/bioc/") #设置默认bioconductor的下载镜像 - 设置默认镜像
Rstudio最重要的两个配置文件:在刚开始运行Rstudio的时候,程序会查看许多配置内容,其中一个就是.Renviron,它是为了设置R的环境变量(这里先不说它);而.Rprofile就是一个代码文件,如果启动时找到这个文件,那么就替我们先运行一遍(这个过程就是在启动Rstudio时完成的)——生信星球
file.edit('~/.Rprofile')后在脚本框敲入
options("repos" = c(CRAN="https://mirrors.tuna.tsinghua.edu.cn/CRAN/"))
options(BioC_mirror="https://mirrors.ustc.edu.cn/bioc/") 保存重启即可,但并不是所有的都可以设置成功,随缘!
安装
- install.packages(“包”)——cran的包
- BiocManager::install(“包”)——bioconductor的包
加载
- library(包)
-
require(包)
-
安装时路径报错——以管理员身份运行rstudio
dplyr的五个基本操作
1.按行数提取
select(test,c(1,5))#列1和5
select(test,1)
mutate(test, new = Sepal.Length * Sepal.Width)#创造新的一列为Sepal.Length乘以Sepal.Width
2.按列名提取
select(test, Petal.Length, Petal.Width)选择Petal.Length和Petal.Width两列
3.筛选
filter(test, Species == "setosa")
filter(test, Species == "setosa"&Sepal.Length > 5 )#筛选species列中的setosa且sepal》length大于5
filter(test, Species %in% c("setosa","versicolor"))#筛选species列中的setosa和versicolor
4.排序
arrange(test, Sepal.Length)#默认以sepal.length从小到大排序
arrange(test, desc(Sepal.Length))#用desc从大到小
?desc#将以降序排列
5.汇总
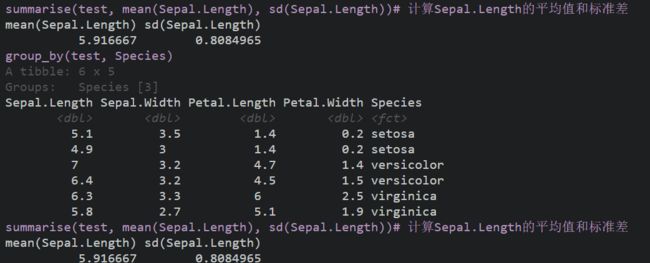
summarise(test, mean(Sepal.Length), sd(Sepal.Length))# 计算Sepal.Length的平均值和标准差
分组汇总先按照Species分组再计算每组Sepal.Length的平均值和标准差
group_by(test, Species)# 按照species分组
summarise(group_by(test, Species),mean(Sepal.Length), sd(Sepal.Length))
管道操作
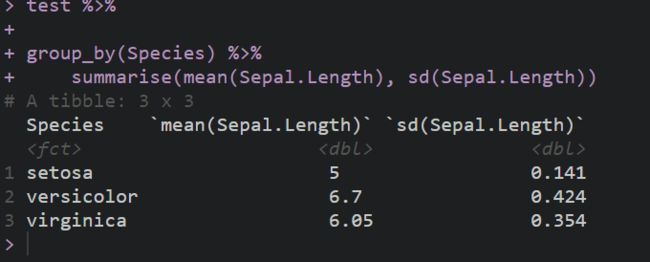
对于数据的连续处理,要么是长长的函数嵌套调用括号包一切;要么就是每次操作赋值一个临时变量。管道操作将两行代码连续
test %>%
group_by(Species) %>%
summarise(mean(Sepal.Length), sd(Sepal.Length))
R语言中管道操作 %>%, %T>%, %$% 和 %%
https://blog.csdn.net/zhaozhn5/article/details/79001384
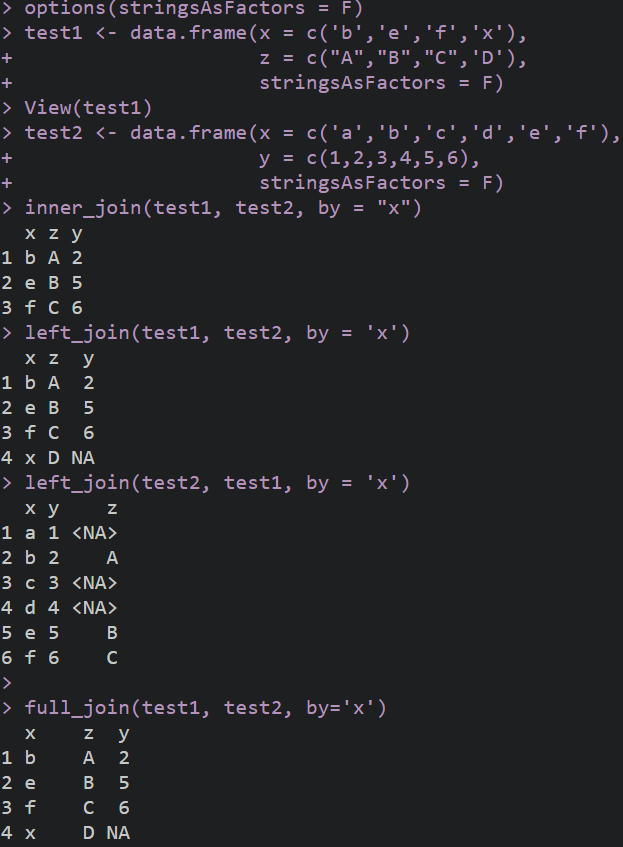
将两个表连接取交集
options(stringsAsFactors = F)
test1 <- data.frame(x = c('b','e','f','x'),
z = c("A","B","C",'D'),
stringsAsFactors = F)
test2 <- data.frame(x = c('a','b','c','d','e','f'),
y = c(1,2,3,4,5,6),
stringsAsFactors = F)#将两个表连接
inner_join(test1, test2, by = "x")#取x的交集
left_join(test2, test1, by = 'x')#左连
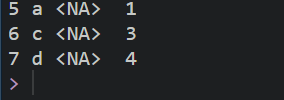
full_join(test1, test2, by='x')#全连
合并表
test1 <- data.frame(x = c(1,2,3,4), y = c(10,20,30,40))
test2 <- data.frame(x = c(5,6), y = c(50,60))
test3 <- data.frame(z = c(100,200,300,400))
bind_rows(test1, test2)#需要列数相同才能合并行
bind_cols(test1, test3)#行数相同才能够合并列


