1、读入数据
path <- "C:\\Users\\Admin\\Documents\\R\\ks\\"
file1 <- "CommViolPredUnnormalizedData.csv"
file2 <- "newdata.csv"

df1 <- read.csv(paste0(path, file1), header = T, stringsAsFactors = F)
pre <- read.csv(paste0(path, file2), header = T, stringsAsFactors = F)
2、导入tidyverse包
library(pacman)
p_load(tidyverse)
3、查看数据名称,并任选两个变量做出散点图
df1 <- tbl_df(df1)

# 查看数据名称
name <- names(df1)
name
##   [1] "communityname"         "state"                 "countyCode"
##   [4] "communityCode"         "fold"                  "population"
##   [7] "householdsize"         "racepctblack"          "racePctWhite"
##  [10] "racePctAsian"          "racePctHisp"           "agePct12t21"
##  [13] "agePct12t29"           "agePct16t24"           "agePct65up"
##  [16] "numbUrban"             "pctUrban"              "medIncome"
##  [19] "pctWWage"              "pctWFarmSelf"          "pctWInvInc"
##  [22] "pctWSocSec"            "pctWPubAsst"           "pctWRetire"
##  [25] "medFamInc"             "perCapInc"             "whitePerCap"
##  [28] "blackPerCap"           "indianPerCap"          "AsianPerCap"
##  [31] "OtherPerCap"           "HispPerCap"            "NumUnderPov"
##  [34] "PctPopUnderPov"        "PctLess9thGrade"       "PctNotHSGrad"
##  [37] "PctBSorMore"           "PctUnemployed"         "PctEmploy"
##  [40] "PctEmplManu"           "PctEmplProfServ"       "PctOccupManu"
##  [43] "PctOccupMgmtProf"      "MalePctDivorce"        "MalePctNevMarr"
##  [46] "FemalePctDiv"          "TotalPctDiv"           "PersPerFam"
##  [49] "PctFam2Par"            "PctKids2Par"           "PctYoungKids2Par"
##  [52] "PctTeen2Par"           "PctWorkMomYoungKids"   "PctWorkMom"
##  [55] "NumKidsBornNeverMar"   "PctKidsBornNeverMar"   "NumImmig"
##  [58] "PctImmigRecent"        "PctImmigRec5"          "PctImmigRec8"
##  [61] "PctImmigRec10"         "PctRecentImmig"        "PctRecImmig5"
##  [64] "PctRecImmig8"          "PctRecImmig10"         "PctSpeakEnglOnly"
##  [67] "PctNotSpeakEnglWell"   "PctLargHouseFam"       "PctLargHouseOccup"
##  [70] "PersPerOccupHous"      "PersPerOwnOccHous"     "PersPerRentOccHous"
##  [73] "PctPersOwnOccup"       "PctPersDenseHous"      "PctHousLess3BR"
##  [76] "MedNumBR"              "HousVacant"            "PctHousOccup"
##  [79] "PctHousOwnOcc"         "PctVacantBoarded"      "PctVacMore6Mos"
##  [82] "MedYrHousBuilt"        "PctHousNoPhone"        "PctWOFullPlumb"
##  [85] "OwnOccLowQuart"        "OwnOccMedVal"          "OwnOccHiQuart"
##  [88] "OwnOccQrange"          "RentLowQ"              "RentMedian"
##  [91] "RentHighQ"             "RentQrange"            "MedRent"
##  [94] "MedRentPctHousInc"     "MedOwnCostPctInc"      "MedOwnCostPctIncNoMtg"
##  [97] "NumInShelters"         "NumStreet"             "PctForeignBorn"
## [100] "PctBornSameState"      "PctSameHouse85"        "PctSameCity85"
## [103] "PctSameState85"        "LemasSwornFT"          "LemasSwFTPerPop"
## [106] "LemasSwFTFieldOps"     "LemasSwFTFieldPerPop"  "LemasTotalReq"
## [109] "LemasTotReqPerPop"     "PolicReqPerOffic"      "PolicPerPop"
## [112] "RacialMatchCommPol"    "PctPolicWhite"         "PctPolicBlack"
## [115] "PctPolicHisp"          "PctPolicAsian"         "PctPolicMinor"
## [118] "OfficAssgnDrugUnits"   "NumKindsDrugsSeiz"     "PolicAveOTWorked"
## [121] "LandArea"              "PopDens"               "PctUsePubTrans"
## [124] "PolicCars"             "PolicOperBudg"         "LemasPctPolicOnPatr"
## [127] "LemasGangUnitDeploy"   "LemasPctOfficDrugUn"   "PolicBudgPerPop"
## [130] "murders"               "murdPerPop"            "rapes"
## [133] "rapesPerPop"           "robberies"             "robbbPerPop"
## [136] "assaults"              "assaultPerPop"         "burglaries"
## [139] "burglPerPop"           "larcenies"             "larcPerPop"
## [142] "autoTheft"             "autoTheftPerPop"       "arsons"
## [145] "arsonsPerPop"          "ViolentCrimesPerPop"   "nonViolPerPop"
# 查看数据类型
str(df1)
## Classes 'tbl_df', 'tbl' and 'data.frame':    2214 obs. of  147 variables:
##  $ communityname        : chr  "BerkeleyHeightstownship" "Marpletownship" "Tigardcity" "Gloversvillecity" ...
##  $ state                : chr  "NJ" "PA" "OR" "NY" ...
##  $ countyCode           : chr  "39" "45" "?" "35" ...
##  $ communityCode        : chr  "5320" "47616" "?" "29443" ...
##  $ fold                 : int  1 1 1 1 1 1 1 1 1 1 ...
##  $ population           : int  11980 23123 29344 16656 11245 140494 28700 59459 74111 103590 ...
##  $ householdsize        : num  3.1 2.82 2.43 2.4 2.76 2.45 2.6 2.45 2.46 2.62 ...
##  $ racepctblack         : num  1.37 0.8 0.74 1.7 0.53 ...
##  $ racePctWhite         : num  91.8 95.6 94.3 97.3 89.2 ...
##  $ racePctAsian         : num  6.5 3.44 3.43 0.5 1.17 0.9 1.47 0.4 1.25 0.92 ...
##  $ racePctHisp          : num  1.88 0.85 2.35 0.7 0.52 ...
##  $ agePct12t21          : num  12.5 11 11.4 12.6 24.5 ...
##  $ agePct12t29          : num  21.4 21.3 25.9 25.2 40.5 ...
##  $ agePct16t24          : num  10.9 10.5 11 12.2 28.7 ...
##  $ agePct65up           : num  11.3 17.2 10.3 17.6 12.6 ...
##  $ numbUrban            : int  11980 23123 29344 0 0 140494 28700 59449 74115 103590 ...
##  $ pctUrban             : num  100 100 100 0 0 100 100 100 100 100 ...
##  $ medIncome            : int  75122 47917 35669 20580 17390 21577 42805 23221 25326 17852 ...
##  $ pctWWage             : num  89.2 79 82 68.2 69.3 ...
##  $ pctWFarmSelf         : num  1.55 1.11 1.15 0.24 0.55 1 0.39 0.67 2.93 0.86 ...
##  $ pctWInvInc           : num  70.2 64.1 55.7 39 42.8 ...
##  $ pctWSocSec           : num  23.6 35.5 22.2 39.5 32.2 ...
##  $ pctWPubAsst          : num  1.03 2.75 2.94 11.71 11.21 ...
##  $ pctWRetire           : num  18.4 22.9 14.6 18.3 14.4 ...
##  $ medFamInc            : int  79584 55323 42112 26501 24018 27705 50394 28901 34269 24058 ...
##  $ perCapInc            : int  29711 20148 16946 10810 8483 11878 18193 12161 13554 10195 ...
##  $ whitePerCap          : int  30233 20191 17103 10909 9009 12029 18276 12599 13727 12126 ...
##  $ blackPerCap          : int  13600 18137 16644 9984 887 7382 17342 9820 8852 5715 ...
##  $ indianPerCap         : int  5725 0 21606 4941 4425 10264 21482 6634 5344 11313 ...
##  $ AsianPerCap          : int  27101 20074 15528 3541 3352 10753 12639 8802 8011 5770 ...
##  $ OtherPerCap          : chr  "5115" "5250" "5954" "2451" ...
##  $ HispPerCap           : int  22838 12222 8405 4391 1328 8104 22594 6187 5174 6984 ...
##  $ NumUnderPov          : int  227 885 1389 2831 2855 23223 1126 10320 9603 27767 ...
##  $ PctPopUnderPov       : num  1.96 3.98 4.75 17.23 29.99 ...
##  $ PctLess9thGrade      : num  5.81 5.61 2.8 11.05 12.15 ...
##  $ PctNotHSGrad         : num  9.9 13.72 9.09 33.68 23.06 ...
##  $ PctBSorMore          : num  48.2 29.9 30.1 10.8 25.3 ...
##  $ PctUnemployed        : num  2.7 2.43 4.01 9.86 9.08 5.72 4.85 8.19 4.18 8.39 ...
##  $ PctEmploy            : num  64.5 62 69.8 54.7 52.4 ...
##  $ PctEmplManu          : num  14.65 12.26 15.95 31.22 6.89 ...
##  $ PctEmplProfServ      : num  28.8 29.3 21.5 27.4 36.5 ...
##  $ PctOccupManu         : num  5.49 6.39 8.79 26.76 10.94 ...
##  $ PctOccupMgmtProf     : num  50.7 37.6 32.5 22.7 27.8 ...
##  $ MalePctDivorce       : num  3.67 4.23 10.1 10.98 7.51 ...
##  $ MalePctNevMarr       : num  26.4 28 25.8 28.1 50.7 ...
##  $ FemalePctDiv         : num  5.22 6.45 14.76 14.47 11.64 ...
##  $ TotalPctDiv          : num  4.47 5.42 12.55 12.91 9.73 ...
##  $ PersPerFam           : num  3.22 3.11 2.95 2.98 2.98 2.89 3.14 2.95 3 3.11 ...
##  $ PctFam2Par           : num  91.4 86.9 78.5 64 58.6 ...
##  $ PctKids2Par          : num  90.2 85.3 78.8 62.4 55.2 ...
##  $ PctYoungKids2Par     : num  95.8 96.8 92.4 65.4 66.5 ...
##  $ PctTeen2Par          : num  95.8 86.5 75.7 67.4 79.2 ...
##  $ PctWorkMomYoungKids  : num  44.6 51.1 66.1 59.6 61.2 ...
##  $ PctWorkMom           : num  58.9 62.4 74.2 70.3 68.9 ...
##  $ NumKidsBornNeverMar  : int  31 43 164 561 402 1511 263 2368 751 3537 ...
##  $ PctKidsBornNeverMar  : num  0.36 0.24 0.88 3.84 4.7 1.58 1.18 4.66 1.64 4.71 ...
##  $ NumImmig             : int  1277 1920 1468 339 196 2091 2637 517 1474 4793 ...
##  $ PctImmigRecent       : num  8.69 5.21 16.42 13.86 46.94 ...
##  $ PctImmigRec5         : num  13 8.65 23.98 13.86 56.12 ...
##  $ PctImmigRec8         : num  21 13.3 32.1 15.3 67.9 ...
##  $ PctImmigRec10        : num  30.9 22.5 35.6 15.3 69.9 ...
##  $ PctRecentImmig       : num  0.93 0.43 0.82 0.28 0.82 0.32 1.05 0.11 0.47 0.72 ...
##  $ PctRecImmig5         : num  1.39 0.72 1.2 0.28 0.98 0.45 1.49 0.2 0.67 1.07 ...
##  $ PctRecImmig8         : num  2.24 1.11 1.61 0.31 1.18 0.57 2.2 0.25 0.93 1.63 ...
##  $ PctRecImmig10        : num  3.3 1.87 1.78 0.31 1.22 0.68 2.55 0.29 1.07 2.31 ...
##  $ PctSpeakEnglOnly     : num  85.7 87.8 93.1 95 94.6 ...
##  $ PctNotSpeakEnglWell  : num  1.37 1.81 1.14 0.56 0.39 0.6 0.6 0.28 0.43 2.51 ...
##  $ PctLargHouseFam      : num  4.81 4.25 2.97 3.93 5.23 3.08 5.08 3.85 2.59 6.7 ...
##  $ PctLargHouseOccup    : num  4.17 3.34 2.05 2.56 3.11 1.92 3.46 2.55 1.54 4.1 ...
##  $ PersPerOccupHous     : num  2.99 2.7 2.42 2.37 2.35 2.28 2.55 2.36 2.32 2.45 ...
##  $ PersPerOwnOccHous    : num  3 2.83 2.69 2.51 2.55 2.37 2.89 2.42 2.77 2.47 ...
##  $ PersPerRentOccHous   : num  2.84 1.96 2.06 2.2 2.12 2.16 2.09 2.27 1.91 2.44 ...
##  $ PctPersOwnOccup      : num  91.5 89 64.2 58.2 58.1 ...
##  $ PctPersDenseHous     : num  0.39 1.01 2.03 1.21 2.94 2.11 1.47 1.9 1.67 6.14 ...
##  $ PctHousLess3BR       : num  11.1 23.6 47.5 45.7 55.6 ...
##  $ MedNumBR             : int  3 3 3 3 2 2 3 2 2 2 ...
##  $ HousVacant           : int  64 240 544 669 333 5119 566 2051 1562 5606 ...
##  $ PctHousOccup         : num  98.4 97.2 95.7 91.2 92.5 ...
##  $ PctHousOwnOcc        : num  91 84.9 57.8 54.9 53.6 ...
##  $ PctVacantBoarded     : num  3.12 0 0.92 2.54 3.9 2.09 1.41 6.39 0.45 5.64 ...
##  $ PctVacMore6Mos       : num  37.5 18.33 7.54 57.85 42.64 ...
##  $ MedYrHousBuilt       : int  1959 1958 1976 1939 1958 1966 1956 1954 1971 1960 ...
##  $ PctHousNoPhone       : num  0 0.31 1.55 7 7.45 ...
##  $ PctWOFullPlumb       : num  0.28 0.14 0.12 0.87 0.82 0.31 0.28 0.49 0.19 0.33 ...
##  $ OwnOccLowQuart       : int  215900 136300 74700 36400 30600 37700 155100 26300 54500 28600 ...
##  $ OwnOccMedVal         : int  262600 164200 90400 49600 43200 53900 179000 37000 70300 43100 ...
##  $ OwnOccHiQuart        : int  326900 199900 112000 66500 59500 73100 215500 52400 93700 67400 ...
##  $ OwnOccQrange         : int  111000 63600 37300 30100 28900 35400 60400 26100 39200 38800 ...
##  $ RentLowQ             : int  685 467 370 195 202 215 463 186 241 192 ...
##  $ RentMedian           : int  1001 560 428 250 283 280 669 253 321 281 ...
##  $ RentHighQ            : int  1001 672 520 309 362 349 824 325 387 369 ...
##  $ RentQrange           : int  316 205 150 114 160 134 361 139 146 177 ...
##  $ MedRent              : int  1001 627 484 333 332 340 736 338 355 353 ...
##  $ MedRentPctHousInc    : num  23.8 27.6 24.1 28.7 32.2 26.4 24.4 26.3 25.2 29.6 ...
##  $ MedOwnCostPctInc     : num  21.1 20.7 21.7 20.6 23.2 17.3 20.8 15.1 20.7 19.4 ...
##  $ MedOwnCostPctIncNoMtg: num  14 12.5 11.6 14.5 12.9 11.7 12.5 12.2 12.8 13 ...
##  $ NumInShelters        : int  11 0 16 0 2 327 0 21 125 43 ...
##  $ NumStreet            : int  0 0 0 0 0 4 0 0 15 4 ...
##  $ PctForeignBorn       : num  10.66 8.3 5 2.04 1.74 ...
##   [list output truncated]
# 选取NumUnderPov和population画散点图
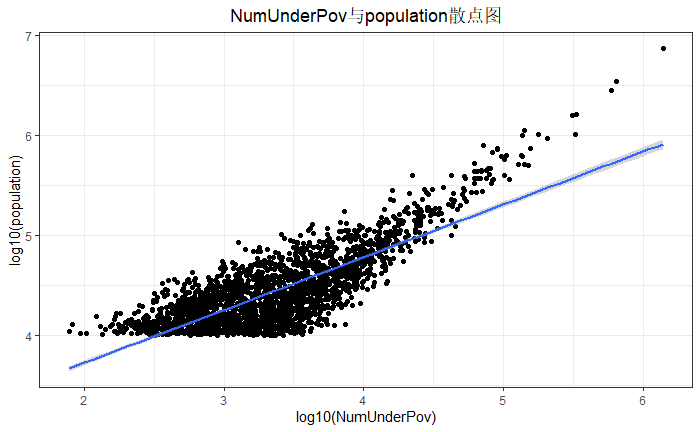
ggplot(df1,aes(log10(NumUnderPov),log10(population))) +
  geom_point() +
  geom_smooth(method = "lm",se=T) +
  theme_bw() +
  labs(title = "NumUnderPov与population散点图") +
  theme(plot.title = element_text(hjust = 0.5))
从整体上来看,NumUnderPov与population之间成正相关关系。
4、找出countyCode和communityCode的缺失值,并删除相应行
nrow(df1)
## [1] 2214
df2 <- df1 %>% filter(countyCode != "?" & communityCode != "?")
nrow(df2)
## [1] 991
5、找出population中的极端值,并滤掉相应的行
# 画出population的箱线图
ggplot(df2,aes(y=population)) +
  geom_boxplot(outlier.colour = "red", outlier.shape = 8) +
  coord_flip() +
  labs(title = "population箱线图") +
  theme_bw() +
  theme(plot.title = element_text(hjust = 0.5))
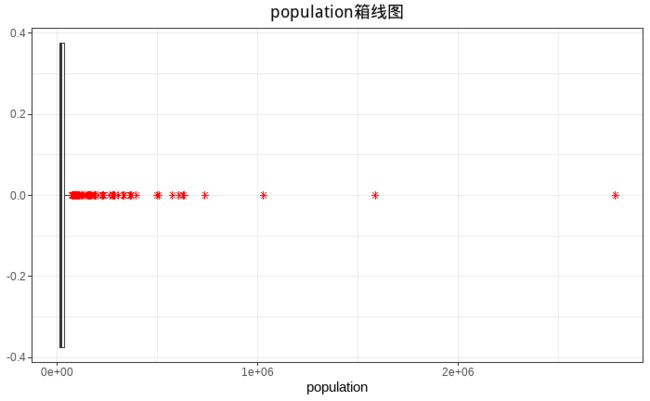
通过箱线图可以看到明显的极端值,因为数据的极差较大,箱线图无法在数据中准确定位极端值。
# 查看数据的最小值和最大值
rng <- range(df2$population)
rng
## [1] 10034 2783726
# 输出异常值列表
out <- boxplot.stats(df2$population)$out

# 过滤掉极端值所在的行
df3 <- filter(df2, population < min(out))
6、以medIncome的自然对数作为因变量,PctUnemployed为自变量回归
fit <- lm(log(medIncome) ~ PctUnemployed, df3)
summary(fit)
##
## Call:
## lm(formula = log(medIncome) ~ PctUnemployed, data = df3)
##
## Residuals:
##     Min      1Q  Median      3Q     Max
## -0.8150 -0.1843  0.0223  0.1788  0.9100
##
## Coefficients:
##               Estimate Std. Error t value            Pr(>|t|)
## (Intercept)   10.97136    0.01995     550 <0.0000000000000002 ***
## PctUnemployed -0.08616    0.00331     -26 <0.0000000000000002 ***
## ---
## Signif. codes:  0 '***' 0.001 '**' 0.01 '*' 0.05 '.' 0.1 ' ' 1
##
## Residual standard error: 0.26 on 886 degrees of freedom
## Multiple R-squared:  0.433,  Adjusted R-squared:  0.432
## F-statistic:  676 on 1 and 886 DF,  p-value: <0.0000000000000002
回归方程为:log(medIncome) = -0.08616 * PctUnemployed + 10.97136
自变量系数P值<2e-16<0.05,所以是在0.05水平上显著。
7、创建新变量highRobPerPop,并选择合适的变量回归
7.1 缺失值处理
# 删除'communityname','state','countyCode','communityCode'变量
df4 <- df3[, -(1:4)]

# 将其他字符型变量转换为数值型
df4 <- df4 %>% purrr::map_if(is.character, as.numeric) %>% tbl_df()

# 计算总缺失值数量
sum(is.na(df4))
## [1] 18861
字符型转换为数值型后,存在18861个缺失值,需要先对缺失值进行处理。
检查缺失值的分布:
p_load(mice)
# 返回数据集中每个变量中缺失值的统计表格
mc <- md.pattern(df4, plot = F)
dim(mc)
## [1] 10 144
# 只查看最终统计行,并转换为数据框
mc <- mc[10, ]
sum.na <- tibble(var = names(mc), sum.na = mc)

# 按缺失值数量排序查看相关变量
n <- filter(sum.na, sum.na > 0) %>% arrange(-sum.na)
print(n)
## # A tibble: 33 x 2
##    var                    sum.na
##
##  1 ""                      18861
##  2 "LemasSwornFT"            832
##  3 "LemasSwFTPerPop"         832
##  4 "LemasSwFTFieldOps"       832
##  5 "LemasSwFTFieldPerPop"    832
##  6 "LemasTotalReq"           832
##  7 "LemasTotReqPerPop"       832
##  8 "PolicReqPerOffic"        832
##  9 "PolicPerPop"             832
## 10 "RacialMatchCommPol"      832
## # ... with 23 more rows
# 缺失值可视化
ggplot(n[-1,],aes(sum.na,var)) +
  geom_bar(stat = "identity") +
  labs(x="缺失值数量",y="") +
  theme_bw()
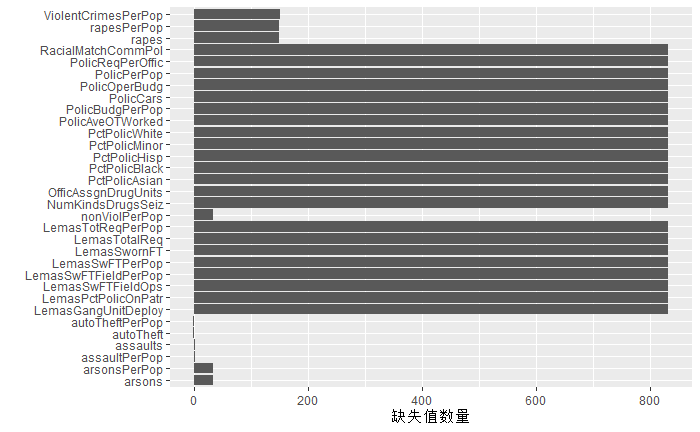
删除包含100个以上缺失值的变量。
nms <- filter(sum.na, sum.na > 100)
df4 <- df4[is.na(match(names(df4), nms$var))]
创建新变量highRobPerPop,robbbPerPop值高于平均值的为1,低于平均值的为0,作为回归的响应变量。
med <- mean(df4$robbbPerPop)
df5 <- df4 %>% mutate(highRobPerPop = as.factor(if_else(robbbPerPop > med, 1, 0))) %>%
    select(-robbbPerPop)

# 查看相应变量的数据分布
table(df5$highRobPerPop)
##
##   0   1
## 656 232
使用均值填充剩下的缺失值:
imputed.data <- mice(df5,
                     # 估算数据集的个数
                     m = 1,
                     # 估算缺失值的迭代次数
                     maxit = 10,
                     # 使用预测平均值匹配法
                     method = "pmm",
                     # 随机数种子
                     seed = 123)
# 使用估算后的数据集
df5 <- complete(imputed.data, 1)
sum(is.na(df5))
## [1] 0
7.2 特征选择
p_load(Boruta)
set.seed(123)
fea.sec <- Boruta(highRobPerPop ~ .,data = df5,
                  # 默认100,最大随机森林运行次数。如果保留待定属性,可以考虑增加此参数
                  maxRuns = 100,
                  # 0代表没有追踪。1表示报告属性决策。 2表示1加上额外报告每个迭代。默认值为0
                  doTrace=2,
                  # TRUE (默认值) 则存储重要性运行的完整历史记
                  holdHistory = T)
fea.sec
## Boruta performed 99 iterations in 4.2 mins.
##  56 attributes confirmed important: arsons, arsonsPerPop,
## assaultPerPop, assaults, autoTheft and 51 more;
##  33 attributes confirmed unimportant: agePct12t21, agePct12t29,
## agePct16t24, agePct65up, AsianPerCap and 28 more;
##  28 tentative attributes left: HousVacant, medFamInc, medIncome,
## MedOwnCostPctInc, MedOwnCostPctIncNoMtg and 23 more;
在我的笔记本上运行了4.2 mins,99次迭代,56个变量确认了重要性,33个确认了不重要,还有28个变量的重要性待定。
再次确认待定的变量:
final.boruta <- TentativeRoughFix(fea.sec)
final.boruta
## Boruta performed 99 iterations in 4.2 mins.
## Tentatives roughfixed over the last 99 iterations.
##  63 attributes confirmed important: arsons, arsonsPerPop,
## assaultPerPop, assaults, autoTheft and 58 more;
##  54 attributes confirmed unimportant: agePct12t21, agePct12t29,
## agePct16t24, agePct65up, AsianPerCap and 49 more;
最终有63个变量确认了重要性,而另外54个确认不重要。
选择确认的变量:
fea.names <- getSelectedAttributes(final.boruta, withTentative = F)
fea.names
##  [1] "population"          "racepctblack"        "racePctWhite"
##  [4] "racePctHisp"         "numbUrban"           "pctUrban"
##  [7] "pctWWage"            "pctWFarmSelf"        "pctWInvInc"
## [10] "pctWPubAsst"         "blackPerCap"         "NumUnderPov"
## [13] "PctPopUnderPov"      "PctLess9thGrade"     "PctNotHSGrad"
## [16] "PctBSorMore"         "PctOccupMgmtProf"    "MalePctDivorce"
## [19] "MalePctNevMarr"      "FemalePctDiv"        "TotalPctDiv"
## [22] "PctFam2Par"          "PctKids2Par"         "PctYoungKids2Par"
## [25] "PctTeen2Par"         "NumKidsBornNeverMar" "PctKidsBornNeverMar"
## [28] "NumImmig"            "PctRecImmig5"        "PctRecImmig8"
## [31] "PctRecImmig10"       "PctLargHouseFam"     "PctLargHouseOccup"
## [34] "PctPersOwnOccup"     "PctPersDenseHous"    "PctHousLess3BR"
## [37] "PctHousOwnOcc"       "PctVacantBoarded"    "PctHousNoPhone"
## [40] "OwnOccMedVal"        "OwnOccHiQuart"       "RentMedian"
## [43] "MedRent"             "MedOwnCostPctInc"    "PctForeignBorn"
## [46] "LandArea"            "PopDens"             "PctUsePubTrans"
## [49] "LemasPctOfficDrugUn" "murders"             "murdPerPop"
## [52] "robberies"           "assaults"            "assaultPerPop"
## [55] "burglaries"          "burglPerPop"         "larcenies"
## [58] "larcPerPop"          "autoTheft"           "autoTheftPerPop"
## [61] "arsons"              "arsonsPerPop"        "nonViolPerPop"
# 创建最终结果的数据框
df6 <- df5[, fea.names]
dim(df6)
## [1] 888 63
7.3 数据标准化,并加入响应变量
df7 <- scale(df6) %>% as_tibble() %>% mutate(highRobPerPop = df5$highRobPerPop)
7.4 将数据集拆分为训练集和测试集
set.seed(0)

ind <- sample(2, nrow(df7), replace = T, prob = c(0.7, 0.3))
train <- df7[ind == 1, ]
test <- df7[ind == 2, ]

dim(train)
## [1] 613 64
dim(test)
## [1] 275 64
7.5 构建随机森林模型
p_load(mlr)
task <- makeClassifTask(id = "df7", data = train, target = "highRobPerPop")

# 创建一个重抽样对象来为随机森林模型调整树的数量
rdesc <- makeResampleDesc("Subsample", iters = 3)

# 建立一个树的网格来调整树的数量
param <- makeParamSet(makeDiscreteParam("ntree", values = c(750, 770, 790, 810,
    1750, 1770, 1790, 1810, 1830)))

# 创建控制对象,建立数值网格
ctrl <- makeTuneControlGrid()

# 调出最优树数量和相应的样本外误差
tuning <- tuneParams("classif.randomForest", task = task, resampling = rdesc, par.set = param,
    control = ctrl)
tuning$x
## $ntree
## [1] 790
tuning$y
## mmce.test.mean
##          0.093
得到最优树的数量为790。使用最优树数量训练模型。
rf <- setHyperPars(makeLearner("classif.randomForest", predict.type = "prob", par.vals = tuning$x))

# 训练模型
fit.rf <- train(rf, task)

# 查看训练集上的混淆矩阵
fit.rf$learner.model
##
## Call:
##  randomForest(formula = f, data = data, classwt = classwt, cutoff = cutoff,      ntree = 790)
##                Type of random forest: classification
##                      Number of trees: 790
## No. of variables tried at each split: 7
##
##         OOB estimate of  error rate: 7.7%
## Confusion matrix:
##     0   1 class.error
## 0 428  17       0.038
## 1  30 138       0.179
可以看到模型在训练集上的袋外估计错误率为7.7%。
7.6 模型在测试集上的准确率
# 看看在测试集上的表现
pred.rf <- predict(fit.rf, newdata = test)
calculateConfusionMatrix(pred.rf)
##         predicted
## true       0  1 -err.-
##   0      202  9      9
##   1       12 52     12
##   -err.-  12  9     21
performance(pred.rf, measures = list(mmce, acc, auc))
##  mmce   acc   auc
## 0.076 0.924 0.970
模型在测试集上的表现与在训练集上差不多。
7.7 预测结果
pre <- pre[, fea.names]
pred.pre <- predict(fit.rf, type = "class", newdata = pre)
pred.pre
## Prediction: 1 observations
## predict.type: prob
## threshold: 0=0.50,1=0.50
## time: 0.00
##   prob.0 prob.1 response
## 1   0.27   0.73        1
输出结果为1(response=1)。即该条记录highRobPerPop=1,该地区robbbPerPop高于平均值。
8、抽取样本
df.coef <- tibble()

df8 <- select(df3, c("medIncome", "PctUnemployed"))

# 确定有无缺失值
sum(is.na(df8))
## [1] 0
for (i in 1:3000) {
    smp <- df8[sample(nrow(df8), 20, replace = T), ]
    fit <- lm(log(medIncome) ~ PctUnemployed, smp)
    df.c <- coef(fit)
    df.coef <- bind_rows(df.coef, df.c)
}

names(df.coef) <- c("incept", "coef")
head(df.coef)
## # A tibble: 6 x 2
##   incept    coef
##
## 1   10.9 -0.0752
## 2   10.8 -0.0667
## 3   10.9 -0.0751
## 4   11.1 -0.0970
## 5   10.8 -0.0587
## 6   11.0 -0.0884
ggplot(df.coef, aes(coef), binwidth = 1) + geom_histogram(bins = 100, fill = "dodgerblue") +
    geom_vline(xintercept = mean(coef, na.rm = T), col = "red", size = 1, linetype = 2) +
    theme_bw() + theme(plot.title = element_text(hjust = 0.5))
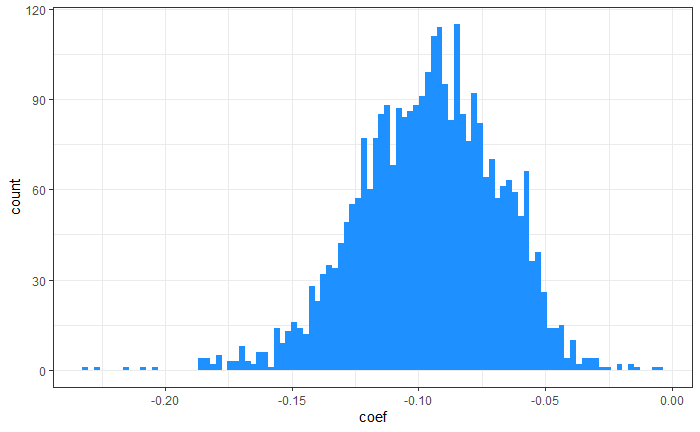
系数值大体呈正态分布,理论基础:中心极限定理。


