作者:Claus O. Wilke
翻译:王诗翔
2018-07-15
plot_grid()基本用法
plot_grid()提供了将图形排列进网格以及为它们添加标签的简单接口:
require(cowplot)
theme_set(theme_cowplot(font_size=12)) # reduce default font size
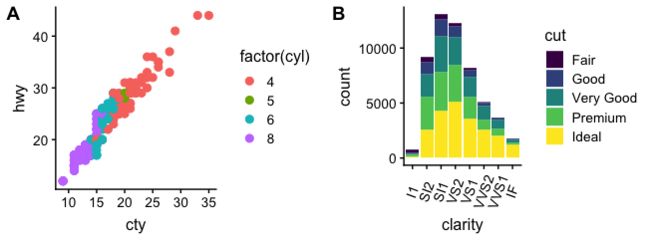
plot.mpg <- ggplot(mpg, aes(x = cty, y = hwy, colour = factor(cyl))) +
geom_point(size=2.5)
plot.diamonds <- ggplot(diamonds, aes(clarity, fill = cut)) + geom_bar() +
theme(axis.text.x = element_text(angle=70, vjust=0.5))
plot_grid(plot.mpg, plot.diamonds, labels = c('A', 'B'))

如果你指定labels="AUTO"或labels="auto",那么标签会自动按照大写或小写排列:
plot_grid(plot.mpg, plot.diamonds, labels = "AUTO")
plot_grid(plot.mpg, plot.diamonds, labels = "auto")

默认,图形不会进行对齐,大多数情况下可以通过align选项对齐:
plot_grid(plot.mpg, plot.diamonds, labels = "AUTO", align = 'h')

plot_grid(plot.mpg, plot.diamonds, labels = "AUTO", ncol = 1, align = 'v')

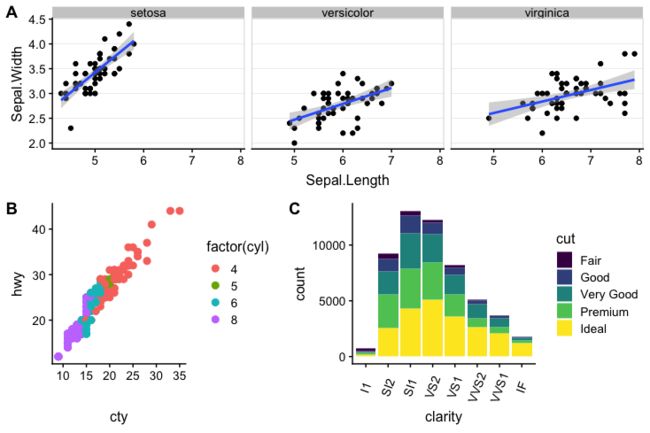
对于绘图元素的数目不同这种更复杂的组合情形,对齐会变得更麻烦。这时,你也需要通过axis选项指定你想要对齐的边界。例如,要对齐一个分面图和一个非分面图,让它们左边轴对齐,我们可以用下面的代码:
plot.iris <- ggplot(iris, aes(Sepal.Length, Sepal.Width)) +
  geom_point() + facet_grid(. ~ Species) + stat_smooth(method = "lm") +
  background_grid(major = 'y', minor = "none") + # add thin horizontal lines
  panel_border() # and a border around each panel
plot_grid(plot.iris, plot.mpg, labels = "AUTO", ncol = 1,
          align = 'v', axis = 'l') # aligning vertically along the left axis

支持的图形类型
函数plot_grid()可以处理几种不同的图形类型,包括ggplot类,gtable以及基本图形等。
For example, the following creates a recordedPlot object by recording a previous plot (plot(sqrt)):
par(xpd = NA, # switch off clipping, necessary to always see axis labels
    bg = "transparent", # switch off background to avoid obscuring adjacent plots
    oma = c(2, 2, 0, 0), # move plot to the right and up
    mgp = c(2, 1, 0) # move axis labels closer to axis
  )
plot(sqrt) # plot the square root function

recordedplot <- recordPlot() # record the previous plot
定义一个创建图形的函数:
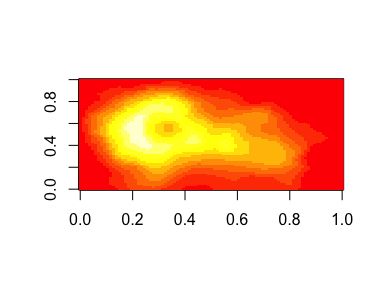
plotfunc <- function() image(volcano) # define the function
plotfunc() # call the function to make the plot
一个用grid绘制的圆:
gcircle <- grid::circleGrob()
ggdraw(gcircle)

现在使用plot_grid()进行组合:
plot_grid(plot.mpg, recordedplot, plotfunc, gcircle, labels = "AUTO", hjust = 0, vjust = 1,
          scale = c(1., 1., 0.9, 0.9))
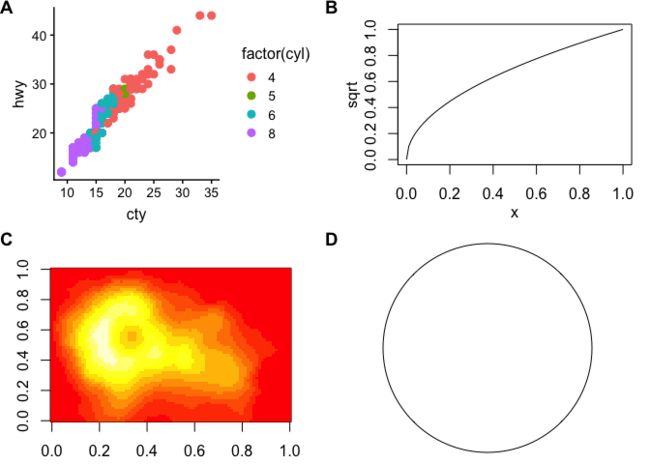
注意许多对齐选项对除ggplot对象的其他图形不适用。
精细调节图形显示
使用 label_size调节标签大小,默认是14。
plot_grid(plot.mpg, plot.diamonds, labels = "AUTO", align = 'h', label_size = 12)

你也可以调节字体家族,字面,标签颜色:
plot_grid(plot.mpg, plot.diamonds, labels = "AUTO", align = 'h', label_fontfamily = "serif",
          label_fontface = "plain", label_colour = "blue")

label_x和label_y参数可以移动标签, 另外可以通过hjust和vjust参数进行矫正。例如,将标签摆在左下角:
plot_grid(plot.mpg, plot.diamonds, labels = "AUTO", align = 'h', label_size = 12,
          label_x = 0, label_y = 0, hjust = -0.5, vjust = -0.5 )

也可以通过对这些选项传入向量调节每个标签的细节(没有展示例子)。
你也可以调节行列的相对高度和宽度:
plot_grid(plot.mpg, plot.diamonds, labels = "AUTO", align = 'h', rel_widths = c(1, 1.3))

嵌套网格
你可以通过在一个plot_grid()中嵌套另外一个plot_grid():
bottom_row <- plot_grid(plot.mpg, plot.diamonds, labels = c('B', 'C'), align = 'h', rel_widths = c(1, 1.3))
plot_grid(plot.iris, bottom_row, labels = c('A', ''), ncol = 1, rel_heights = c(1, 1.2))

(注意这种情况下我们需要手动设置标签),如果对上面的图形进行排列相当有难度,不过我们可以通过align_plots()函数实现。
# first align the top-row plot (plot.iris) with the left-most plot of the
# bottom row (plot.mpg)
plots <- align_plots(plot.mpg, plot.iris, align = 'v', axis = 'l')
# then build the bottom row
bottom_row <- plot_grid(plots[[1]], plot.diamonds,
                        labels = c('B', 'C'), align = 'h', rel_widths = c(1, 1.3))
# then combine with the top row for final plot
plot_grid(plots[[2]], bottom_row, labels = c('A', ''), ncol = 1, rel_heights = c(1, 1.2))