python dataframe的某一列变为list_Python数据分析系列文章之Pandas(上)
本篇是【机器学习与数据挖掘】头条号原创首发Python数据分析系列文章的第三篇
- Python数据分析系列文章之Python基础篇
- Python数据分析系列文章之Numpy
- Python数据分析系列文章之Pandas(上)
- Python数据分析系列文章之Pandas(下)
- Python数据分析系列文章之Scipy
- Python数据分析系列文章之Matplotlib
- Python数据分析系列文章之Seaborn
- Python数据分析系列文章之Polty
- Python数据分析系列文章之datetime
本章介绍python数据分析中比较主要的一个库pandas的使用,pandas篇分上下两部分,本节主要介绍pandas使用中一些比较重要的操作。
本节目录:
- 基本数据结构
- 基本功能
- 数据读存与文件格式
- 总结
基本数据结构
想要熟练的使用pandas,就需要了解pandas中两种重要的数据结构:Series和DataFrame。
import pandas as pdSeries
1、创建
pd.Series(data=None, index=None, dtype=None, name=None, copy=False, fastpath=False)Series一种类似于一维数组的数据对象,由一组数据和一组与之对应的索引组成。series创建方式有四种:
- 使用Python列表创建
- 使用numpy数组创建
- 使用Python字典创建
- 使用单个标量值创建
#左边为索引,右边为值,没有设置索引,则自动创建0-n的整数序列s1 = pd.Series(np.array([1,2,3,4,5,np.nan]))s2 = pd.Series([1,2,3,4,5])s3 = pd.Series({'a':1,'b':2,'c':3,'d':4})s4 = pd.Series(3)#可以自带索引值s5 = pd.Series([1,2,3,4,5],index=list('abcde'))2、性质
下面主要介绍Series使用中一些常见的方法
#属性s1.index#RangeIndex(start=0, stop=5, step=1)#值s1.values#array([1, 2, 3, 4, 5]) #一维数组s1.value_counts(dropna=True) #值统计,平时用的比较多s1.notnull()s1.isnull() #返回元素是否缺失s1.fillna(0) #缺失值填充s1.drop_duplicates() #去重s1.apply(lambda x:x+1) #用的比较多的性质s2.astype('int') #如果里面有一些不能转为该类型的元素值(如NA,'a')就会出错。s2.iat[0] #取第一个元素,不是按照indexs2.dtypes #dtype('int64'),类型s2.nunique() #5,Series中的元素个数,没有重复的#修改indexindex = ['a1','b1','c1','d1','e1']s5 = pd.Series(dict(s3),index=index)s5#a1 1.0b1 2.0c1 3.0d1 4.0e1 NaNdtype: float643、取值与运算
###取值####s1[2] #通过index取数据s3.iat[2] #通过index的顺序取 s1[s1>=3] #取出Series中大于等于3的子集,返回的还是Seriess1[s1.isnull()==True] #去元素为空缺值的子Series###运算###s2**2#0 21 42 63 84 10dtype: int64s2+s2 #输出同上np.exp(s2)#0 2.7182821 7.3890562 20.0855373 54.5981504 148.413159dtype: float64DataFreme
1、创建
DataFrame是一种表格型的数据结构,它含有一组有序的列,每一列元素值类型可以是数值型、类别型、布尔类型,有行和列索引,可以看成是有Series组成的字典,DataFrame中的数据可以是一个或者多个二维块组成(不是列表、字典或其他一维数据结构)。
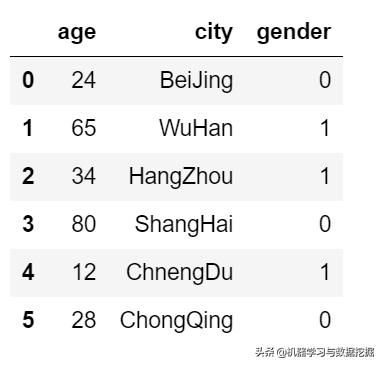
data = {'city': ['BeiJing','WuHan','HangZhou','ShangHai','ChnengDu','ChongQing'], 'gender':[0,1,1,0,1,0], 'age':[24,65,34,80,12,28]})d1 = pd.DataFrame(data)自动添加了索引,可以根据指定列的顺序进行排列。
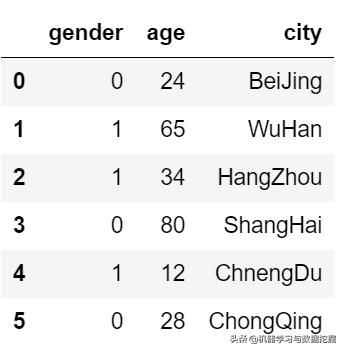
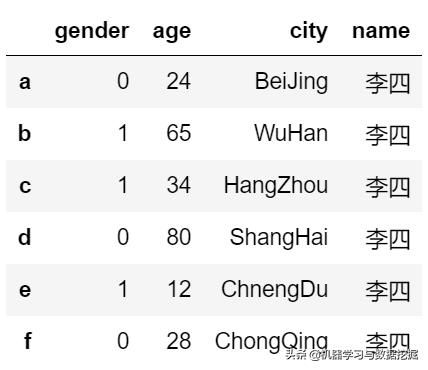
#类似于Series,如果传入的列没有值,则为空(NaN)d2 = pd.DataFrame(data,columns=['gender','age','city'])d3 = pd.DataFrame(data,columns=['gender','age','city','name'],index=[list('abcdef')]2、性质
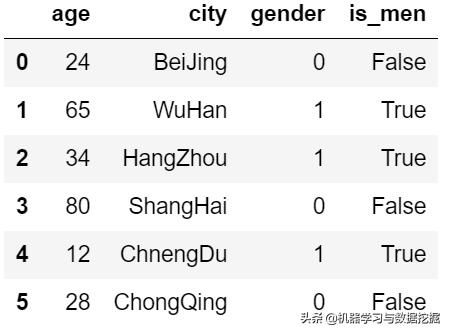
#取一列d1['age'] #为Series对象,返回索引为原DataFrame的索引,等价于d1.age#0 241 652 343 804 125 28Name: age, dtype: int64#取一行d1.ix[3]#age 80city ShangHaigender 0Name: 3, dtype: objectd1.loc[3] #取行做使用.loc或者.iloc。#age 80city ShangHaigender 0Name: 3, dtype: object#赋值修改d3.name = '李四'#新加入一类d1['is_men'] = d1.geder==1s1.values #array格式数据注意:
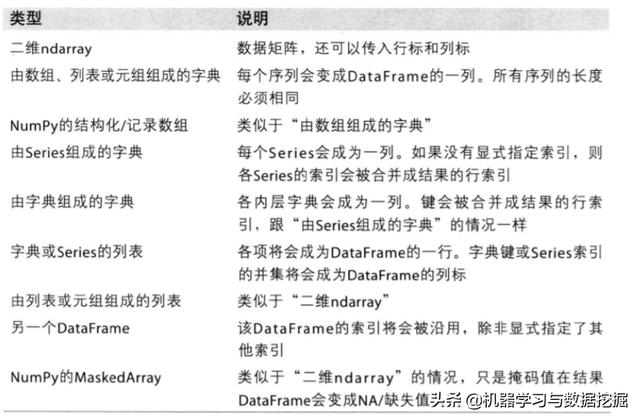
构造DataFrame的数据输入格式多种多样,主要有以下几种;
索引对象
pandas索引对象是负责管理轴或者其他元数据,在构建Series或者DataFrame时,所用数组或者其他序列标签都会转换成index。
s3.index#Index([u'a', u'b', u'c', u'd'], dtype='object')s3.index[2:] #Index([u'c', u'd'], dtype='object')#Index对象不能被修改index的对象类型:
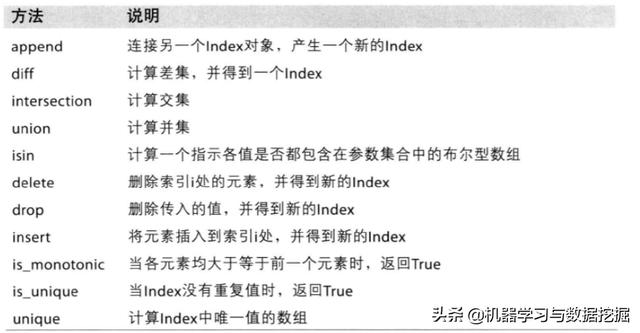
索引的一些属性和方法:
#可以当成两个一维数组或者Series处理s1.index.append(s3.index)#Index([0, 1, 2, 3, 4, 5, u'a', u'b', u'c', u'd'], dtype='object')时s3.index.is_unique #Trues3.index.nunqiue() #4基本功能
本章将重点讲解在数据分析中Series和DataFrame常用处理方法。
重新索引
reindex方法,重新索引,即创建一个新索引的新对象。适用于Series和DataFrame
1、Series
####对于Seriess1 = pd.Series({'a':1,'b':2,'c':3,'d':4})#根据新索引重新排列,索引值不存在即为缺失值,fill_value表示缺失值的填充s2 = s1.reindex(list('abcdef'),fill_value=0) #a 1.0b 2.0c 3.0d 4.0e 0.0f 0.0dtype: float64#对于时间序列,重新索引可以通过method参数引入插值s3 = pd.Series(['a','b','c'],index=[0,2,4])#ffill表示前向填充,bfill表示后向s4 = s3.reindex(range(6),method='ffill')#0 a1 a2 b3 b4 c5 cdtype: object2、DataFrame
对于DataFrame,reindex既可以修改行索引,也可以修改列索引。
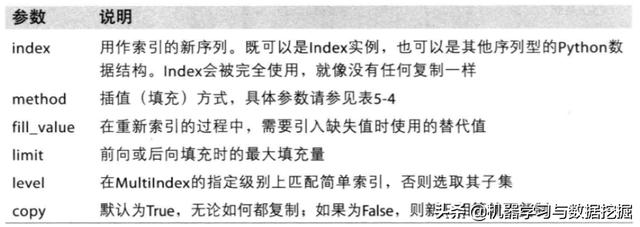
index = ['Firefox', 'Chrome', 'Safari', 'IE10', 'Konqueror']df = pd.DataFrame({ 'http_status': [200,200,404,404,301], 'response_time': [0.04, 0.02, 0.07, 0.08, 1.0]}, index=index)df # http_status response_timeFirefox 200 0.04Chrome 200 0.02Safari 404 0.07IE10 404 0.08Konqueror 301 1.0#重新行索引new_index= ['Safari', 'Iceweasel', 'Comodo Dragon', 'IE10','Chrome']df.reindex(new_index)df# http_status response_timeSafari 404.0 0.07Iceweasel NaN NaNComodo Dragon NaN NaNIE10 404.0 0.08Chrome 200.0 0.02#缺失值填充df.reindex(new_index, fill_value=0) # http_status response_timeSafari 404 0.07Iceweasel 0 0.00Comodo Dragon 0 0.00IE10 404 0.08Chrome 200 0.02#重新列索引df.reindex(columns=['http_status', 'user_agent'])#等价于df.reindex(['http_status', 'user_agent'], axis="columns")# http_status user_agentFirefox 200 NaNChrome 200 NaNSafari 404 NaNIE10 404 NaNKonqueror 301 NaN#对于数据序列的重新索引问题date_index = pd.date_range('1/1/2010', periods=6, freq='D')df2 = pd.DataFrame({"prices": [100, 101, np.nan, 100, 89, 88]}, index=date_index)df2# prices2010-01-01 100.02010-01-02 101.02010-01-03 NaN2010-01-04 100.02010-01-05 89.02010-01-06 88.0date_index2 = pd.date_range('12/29/2009', periods=10, freq='D')df2.reindex(date_index2)# prices2009-12-29 NaN2009-12-30 NaN2009-12-31 NaN2010-01-01 100.02010-01-02 101.02010-01-03 NaN2010-01-04 100.02010-01-05 89.02010-01-06 88.02010-01-07 NaNdf2.reindex(date_index2, method='bfill')# prices2009-12-29 100.02009-12-30 100.02009-12-31 100.02010-01-01 100.02010-01-02 101.02010-01-03 NaN2010-01-04 100.02010-01-05 89.02010-01-06 88.02010-01-07 NaN3、参数说明
行列筛选
#seriess1 =pd.Series(np.arange(5.), index=['a', 'b', 'c', 'd', 'e'])new_obj = s1.drop(['b','c']) #行删除new_obja 0.0b 1.0e 4.0dtype: float64#DataFramedf1 = pd.DataFrame(np.arange(16).reshape((4, 4)), index=['Ohio', 'Colorado', 'Utah', 'New York'], columns=['one', 'two', 'three', 'four'])df1.drop(['Colorado', 'Ohio']) #行删除df1.drop('two', axis=1) #列删除,axis默认为0轴索引、选取、过滤
1、使用
s1 = pd.Series(np.arange(4), index=['a', 'b', 'c', 'd'])s1['b'] #1.0s1[1] #1.0s1[2:4]#c 2.0d 3.0dtype: float64s1[['b', 'a', 'd']]#b 1.0a 0.0d 3.0dtype: float64s1[obj < 2]#a 0.0b 1.0dtype: float64obj['b':'c'] = 5obj#a 0.0b 5.0c 5.0d 3.0#DataFramedf1 = pd.DataFrame(np.arange(16).reshape((4, 4)), index=['Ohio', 'Colorado', 'Utah', 'New York'], columns=['one', 'two', 'three', 'four'])df1# one two three fourOhio 0 1 2 3Colorado 4 5 6 7Utah 8 9 10 11New York 12 13 14 15df1['two'] #选列#Ohio 1Colorado 5Utah 9New York 13Name: two, dtype: int64df1[['three', 'one']] #选多列# three oneOhio 2 0Colorado 6 4Utah 10 8New York 14 12df1[:2] #选多行# one two three fourOhio 0 1 2 3Colorado 4 5 6 7df1[df1['three'] > 5]#筛选 # one two three fourColorado 4 5 6 7Utah 8 9 10 11New York 12 13 14 15df1 < 5# one two three fourOhio True True True TrueColorado True False False FalseUtah False False False FalseNew York False False False Falsedf1[data < 5] = 0 #赋值# one two three fourOhio 0 1 2 3Colorado 4 5 6 7Utah 8 9 10 11New York 12 13 14 15df1.ix['Colorado', ['two', 'three']] #行列筛选#two 5three 6Name: Colorado, dtype: int64df1.ix[['Colorado', 'Utah'], [3, 0, 1]]# four one twoColorado 7 4 5Utah 11 8 9df1.ix[2]#one 8two 9three 10four 11Name: Utah, dtype: int64#df1.ix[data.three > 5, :3]# one two threeColorado 4 5 6Utah 8 9 10New York 12 13 14#注:在最近的版本中,筛选数据使用.ix易出现警告,建议使用.loc,.iloc2、索引选项
运算与数据对齐
pandas可以对不同索引的对象进行算术运算,运算后对象的索引相当于索引对的并集。
1、算术运算
s1 = pd.Series([7.3, -2.5, 3.4, 1.5], index=['a', 'c', 'd', 'e'])s2 = pd.Series([-2.1, -1.5, 4, 3.1], index=['a', 'e', 'f', 'g'])s1+s2#a 5.2c NaNd NaNe 0.0f NaNg NaNdtype: float64df1 = pd.DataFrame(np.arange(9).reshape((3, 3)), columns=list('bcd'), index=['Ohio', 'Texas', 'Colorado'])df2 = pd.DataFrame(np.arange(12).reshape((4, 3)), columns=list('bde'), index=['Utah', 'Ohio', 'Texas', 'Oregon'])df1+df2# a b c d e0 0.0 2.0 4.0 6.0 NaN1 9.0 11.0 13.0 15.0 NaN2 18.0 20.0 22.0 24.0 NaN3 NaN NaN NaN NaN NaN#缺失填充df1.add(df2, fill_value=0)# a b c d e0 0.0 2.0 4.0 6.0 4.01 9.0 11.0 13.0 15.0 9.02 18.0 20.0 22.0 24.0 14.03 15.0 16.0 17.0 18.0 19.0#Series与DataFrame之间的运算,与不同形状数组之间的运算类似df1= pd.DataFrame(np.arange(12.).reshape((4, 3)), columns=list('bde'), index=['Utah', 'Ohio', 'Texas', 'Oregon'])s1= df1.ix[0]df1-s1# b d eUtah 0.0 0.0 0.0Ohio 3.0 3.0 3.0Texas 6.0 6.0 6.0Oregon 9.0 9.0 9.0s2 = df1['d']df1.sub(s2, axis=0) #减法,广播# b d eUtah -1.0 0.0 1.0Ohio -1.0 0.0 1.0Texas -1.0 0.0 1.0Oregon -1.0 0.0 1.0函数应用和映射
主要介绍在pandas使用中常用的apply()、map()、applymap()三种方法。
- apply()
- applymap()
- map()
#df2= pd.DataFrame(np.random.randn(4, 3), columns=list('bde'), index=['Utah', 'Ohio', 'Texas', 'Oregon'])np.abs(df2)# b d eUtah 0.690002 1.001543 0.503087Ohio 0.622274 0.921169 0.726213Texas 0.222896 0.051316 1.157719Oregon 0.816707 0.433610 1.010737#apply方法,应用中既可以是Python内置函数,也可以是自己构造f = lambda x: x.max() - x.min()df2.apply(f) #默认0轴#b 1.802165d 1.684034e 2.689627dtype: float64df2.apply(f, axis=1)#Utah 0.998382Ohio 2.521511Texas 0.676115Oregon 2.542656dtype: float#applymap方法f1 = lambda x: '%.2f' % xdf2.applymap(f1)# b d eUtah 0.69 1.00 -0.50Ohio -0.62 -0.92 -0.73Texas 0.22 0.05 -1.16Oregon 0.82 0.43 1.01#map方法df2['e'].map(format)#Utah -0.50Ohio -0.73Texas -1.16Oregon 1.01Name: e, dtype: objec排序和排名
对DataFrame(Series)中的行或者列进行排序或者排名是数据分析中非常重要的内置运算。
- sort_index():主要用来进行行(列)索引排序。
- sort_values():主要对某一列(行)进行排序。
- rank():
1、sort_index
sort_index(axis=0, level=None, ascending=True, inplace=False, kind='quicksort', na_position='last', sort_remaining=True, by=None)
使用实例:
s1 = pd.Series(range(4), index=['d', 'a', 'b', 'c'])s1.sort_index()#a 1b 2c 3d 0dtype: int64#按行索引排序df1 = DataFrame(np.arange(8).reshape((2, 4)), index=['three', 'one'], columns=['d', 'a', 'b', 'c'])df1.sort_index()# d a b cone 4 5 6 7three 0 1 2 3#按列索引排序df1.sort_index(axis=1)# a b c dthree 1 2 3 0one 5 6 7 4#列索引递减df1.sort_index(axis=1, ascending=False)# d c b athree 0 3 2 1one 4 7 6 52、sort_values
sort_values(by=None,axis=0,ascending=True, inplace=False, na_position=‘last’)
使用实例:
df1 = pd.DataFrame({'c1':['A','B','B',np.nan,'C','D'], 'c2':[1,1,4,2,3,7], 'c3':[0,1,5,3,1,6]})#按列df1.sort_values(by=['c1'],ascending=False,na_position='first')# c1 c2 c33 NaN 2 35 D 7 64 C 3 11 B 1 12 B 4 50 A 1 0df1.sort_values(by=['c2','c3'],ascending=False)# c1 c2 c35 D 7 62 B 4 54 C 3 13 NaN 2 31 B 1 10 A 1 0#按行df1.sort_values(by=2,ascending=False,axis=1) # c1 c3 c23 NaN 3 25 D 6 74 C 1 31 B 1 12 B 5 40 A 0 1df1.sort_values(by=['c1'],na_position='first')# c1 c2 c33 NaN 2 30 A 1 01 B 1 12 B 4 54 C 3 15 D 7 6 3、rank
rank(axis=0, method='average', numeric_only=None, na_option='keep', ascending=True, pct=False)
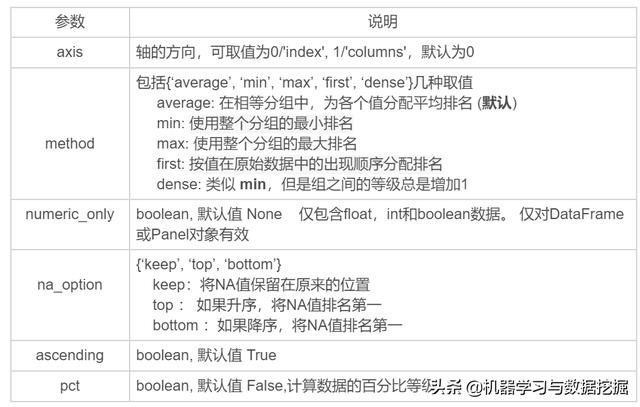
主要参数说明:
使用实例:
s1= pd.Series([5, 9, 2, 10, 9, 2, 0])s1.rank() #遇到两个数相等,就取这两个数排名的平均值0 4.01 5.52 2.53 7.04 5.55 2.56 1.0dtype: float64s1.rank(method='first')#0 4.01 5.02 2.03 7.04 6.05 3.06 1.0dtype: float64s1.rank(method='max')#0 4.01 6.02 3.03 7.04 6.05 3.06 1.0dtype: float64df1 = pd.DataFrame({'b': [4.3, 7, -3, 2], 'a': [0, 1, 0, 1], 'c': [-2, 5, 8, -2.5]})df1.rank(axis=1)# a b c0 2.0 3.0 1.01 1.0 3.0 2.02 2.0 1.0 3.03 2.0 3.0 1.0df1.rank()# a b c0 1.5 3.0 2.01 3.5 4.0 3.02 1.5 1.0 4.03 3.5 2.0 1.0统计与计算
介绍一些pandas常用的数学以及统计方法。
df1 = pd.DataFrame([[1.4, np.nan], [7.1, -4.5], [np.nan, np.nan], [0.75, -1.3]], index=['a', 'b', 'c', 'd'], columns=['one', 'two'])df1.sum() #axis表示按照哪个轴进行计算#one 9.25two -5.80dtype: float64df1.mean(axis=1, skipna=False)#a NaNb 1.300c NaNd -0.275dtype: float64df.idxmax() #最大值对应的索引#one btwo ddtype: objectdf1.cumsum() #累加# one twoa 1.40 NaNb 8.50 -4.5c NaN NaNd 9.25 -5.8df1.describe()# one twocount 3.000000 2.000000mean 3.083333 -2.900000std 3.493685 2.262742min 0.750000 -4.50000025% 1.075000 -3.70000050% 1.400000 -2.90000075% 4.250000 -2.100000max 7.100000 -1.300000缺失值处理
缺失值的处理是数据分析中一个重要的知识点,pandas在处理缺失值方面也提供一些重要的方法。
- isnull()
- notnull()
- dropna()
- fillna()
s1= pd.Series(['aardvark', 'artichoke', np.nan, 'avocado'])s1.isnull() #判断系列里面元素缺失,是返回True#0 False1 False2 True3 Falsedtype: bools1.notnull() #判断系列里面元素不缺失,是返回True#0 True1 True2 False3 Truedtype: bool#pandas内置的None也被认为是缺失值#通过缺失值进行数据筛选s1[s1.notnull()]#0 aardvark1 artichoke3 avocadodtype: object#缺失值过滤s1.dropna() #对于DataFrame有一些参数0 aardvark1 artichoke3 avocadodtype: objectfrom numpy import nan as NAdata = DataFrame([[1., 6.5, 3.], [1., NA, NA], [NA, NA, NA], [NA, 6.5, 3.]])data.dropna() #默认删除有缺失值的行#01201.06.53.0data.dropna(how='all') #删除全部缺失的行# 0 1 20 1.0 6.5 3.01 1.0 NaN NaN3 NaN 6.5 3.0data[4] = NA #加一列全部缺失data.dropna(axis=1, how='all') #按列删除全缺失的# 0 1 20 1.0 6.5 3.01 1.0 NaN NaN2 NaN NaN NaN3 NaN 6.5 3.0data.dropna(thresh=3) #按行非缺失值的个数# 0 1 2 40 1.0 6.5 3.0 NaN data.dropna(subset=[0,1,2],thresh=1) #subset设置需要统计的列范围# 0 1 2 40 1.0 6.5 3.0 NaN1 1.0 NaN NaN NaN3 NaN 6.5 3.0 NaN#缺失填充df1 = DataFrame(np.random.randn(7, 3))df1.ix[:4, 1] = NA; df1.ix[:2, 2] = NAdf1# 0 1 20 1.824875 NaN NaN1 -0.131578 NaN NaN2 2.169461 NaN NaN3 0.029610 NaN 0.1181104 -0.748532 NaN 0.1526775 -1.565657 -0.562540 -0.0326646 -0.929006 -0.482573 -0.036264df1.fillna(0)# 0 1 20 1.824875 0.000000 0.0000001 -0.131578 0.000000 0.0000002 2.169461 0.000000 0.0000003 0.029610 0.000000 0.1181104 -0.748532 0.000000 0.1526775 -1.565657 -0.562540 -0.0326646 -0.929006 -0.482573 -0.036264df1.fillna({1: 0.5, 3: -1}) #按列填充# 0 1 20 1.824875 0.500000 NaN1 -0.131578 0.500000 NaN2 2.169461 0.500000 NaN3 0.029610 0.500000 0.1181104 -0.748532 0.500000 0.1526775 -1.565657 -0.562540 -0.0326646 -0.929006 -0.482573 -0.03626层次化索引
层次化索引是pandas中一个重要的功能,它可以让数据在一个轴上有两个或以上的索引,这样能够以低维形式处理高维数据。
df1= Series(np.random.randn(10), index=[['a', 'a', 'a', 'b', 'b', 'b', 'c', 'c', 'd', 'd'], [1, 2, 3, 1, 2, 3, 1, 2, 2, 3]])df1#a 1 0.670216 2 0.852965 3 -0.955869b 1 -0.023493 2 -2.304234 3 -0.652469c 1 -1.218302 2 -1.332610d 2 1.074623 3 0.723642dtype: float64df1.index #索引#MultiIndex(levels=[[u'a', u'b', u'c', u'd'], [1, 2, 3]], codes=[[0, 0, 0, 1, 1, 1, 2, 2, 3, 3], [0, 1, 2, 0, 1, 2, 0, 1, 1, 2]])df['b'] #取数据 #1 -0.0234932 -2.3042343 -0.652469dtype: float64df['b':'c'] #b 1 -0.023493 2 -2.304234 3 -0.652469c 1 -1.218302 2 -1.332610dtype: float64df1.ix[['b', 'd']] #b 1 -0.023493 2 -2.304234 3 -0.652469d 2 1.074623 3 0.723642dtype: float64 df1.unstack() #数据重塑# 1 2 3a 1.095390 0.980928 -0.589488b 1.581700 -0.528735 0.457002c 0.929969 -1.569271 NaNd NaN -1.022487 -0.402827数据读存与文件格式
数据读取与存储
pandas提供了一系列将表格型数据读取为DataFrame对象的函数,如下图所示:
以read_csv读取数据为例:
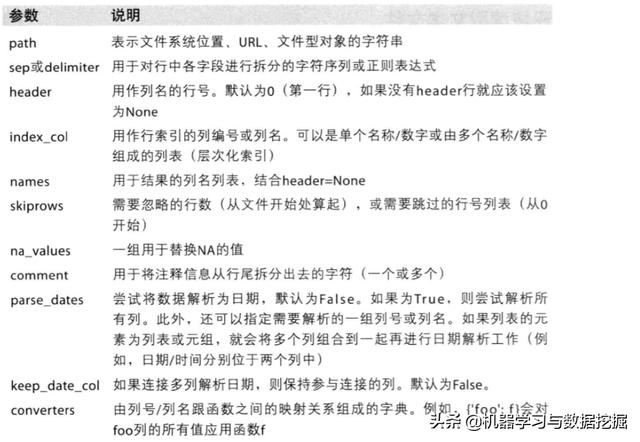
read_csv(filepath_or_buffer, sep=', ', delimiter=None, header='infer', names=None, index_col=None, usecols=None, squeeze=False, prefix=None, mangle_dupe_cols=True, dtype=None, engine=None, converters=None, true_values=None, false_values=None, skipinitialspace=False, skiprows=None, skipfooter=0, nrows=None, na_values=None, keep_default_na=True, na_filter=True, verbose=False, skip_blank_lines=True, parse_dates=False, infer_datetime_format=False, keep_date_col=False, date_parser=None, dayfirst=False, iterator=False, chunksize=None, compression='infer', thousands=None, decimal=b'.', lineterminator=None, quotechar='"', quoting=0, doublequote=True, escapechar=None, comment=None, encoding=None, dialect=None, tupleize_cols=None, error_bad_lines=True, warn_bad_lines=True, delim_whitespace=False, low_memory=True, memory_map=False, float_precision=None)
参数含义:
关于存储数据pandas提供了to_csv()方法,用法类似于read_csv(),在这里不再展开。
手工处理分隔符数据
由于有一些文件含义有些有问题的数据行,直接使用pandas自带的数据读取方法可能会出现问题,因此需要一些手工处理。本节介绍python内置的csv模块处理数据。
import csv#csv读取数据f = open('file.csv')reader = csv.reader(f)for line in reader: print(line) #每一行以列表的形式呈现#数据解析lines = list(csv.reader(open('file.csv')))header, values = lines[0], lines[1:]data_dict = {h: v for h, v in zip(header, zip(*values))}csv参数解释:
JSON数据
JSON是一种比表格型文本格式更灵活的数据格式。
json_data= """{"name": "Wes
