作者:白介素2
相关阅读:
R语言生存分析04-Cox比例风险模型诊断
R语言生存分析03-Cox比例风险模型
R语言生存分析-02-ggforest
R语言生存分析-01
ggpubr-专为学术绘图而生(二)
ggstatsplot-专为学术绘图而生(一)
生存曲线
R语言GEO数据挖掘01-数据下载及提取表达矩阵
R语言GEO数据挖掘02-解决GEO数据中的多个探针对应一个基因
R语言GEO数据挖掘03-limma分析差异基因
R语言GEO数据挖掘04-功能富集分析
如果没有时间精力学习代码,推荐了解:零代码数据挖掘课程
差异基因与基因交集
if(T){
require(tidyverse)
AS_gene<-read.table("F:/Bioinfor_project/Breast/AS_research/AS/result/BRCA_marker_cox_single_all.txt",header =T,sep = "\t")
AS_gene[1:5,1:5]
final_DEmRNA<-read.csv("F:/Bioinfor_project/Breast/AS_research/AS/result/TNBC_DEmRNA.csv",header=T,row.names = 1)
DEG_2<-final_DEmRNA %>%
  rownames_to_column("genename")
hubgene<-intersect(AS_gene$symbol,DEG_2$genename)
}
清洗数据-进一步探索
if(T){
require(dplyr)
## 提取已标准化的数据
mRNA_exp<-read.csv(file="F:/Bioinfor_project/Breast/AS_research/AS/result/TNBC_mRNA_exp_log.csv",header = T,row.names = 1)
load("F:/Bioinfor_project/Breast/TCGA/RNA-seq-model/BRCA_all.Rdata")
BRCA_all[1:5,1:5]
dim(BRCA_all)## 24491 1200
head(phe)
colnames(phe)

##
mRNA_exp[1:5,1:5]
dim(mRNA_exp)
data_exp<-mRNA_exp[hubgene,]
## 提取匹配的临床信息
data_phe<-phe %>%
  filter(ID %in% colnames(mRNA_exp))

## 合并临床信息与表达数据
data<-data_exp %>% t() %>% as.data.frame() %>%
    ##行名变列名
    rownames_to_column(var = "ID") %>%
    as_tibble() %>%
    ## 合并临床信息与表达数据
    inner_join(data_phe,by="ID") %>%
    ## 增加分组信息
    mutate(group=ifelse(substring(colnames(mRNA_exp),14,15)=="01","TNBC","Normal")) %>%
    ## 分组提前
    dplyr::select(ID,group,everything())
group=factor(c(rep(1,115),rep(0,113)))
head(data)
#save(data,file = "F:/Bioinfor_project/Breast/AS_research/AS/result/hubgene.Rdata")
}
## # A tibble: 6 x 22
##   ID    group CCL14  HBA1 CCL16 TUBB3 PAM50 Os_time OS_event RFS_time
##
## 1 TCGA~ TNBC   3.37  0     0     5.94 Basal     967        1       NA
## 2 TCGA~ TNBC   4.97  3.39  0     6.00 Basal     584        0       NA
## 3 TCGA~ TNBC   4.77  0     0     5.04 Basal    2654        0       NA
## 4 TCGA~ TNBC   4.19  3.74  2.84  5.13 Basal     754        1       NA
## 5 TCGA~ TNBC   0     0     0     5.65 Basal    2048        0     2048
## 6 TCGA~ TNBC   5.34  0     4.07  6.04 Basal    1027        0     1027
## # ... with 12 more variables: RFS_event , age , ER ,
## #   PR , gender , HER2 , Margin_status , Node ,
## #   M_stage , N_stage , T_stage , `Pathologic stage`
载入数据
数据清洗-gather-spread
load(file = "F:/Bioinfor_project/Breast/AS_research/AS/result/hubgene.Rdata")
head(data)
## # A tibble: 6 x 22
##   ID    group CCL14  HBA1 CCL16 TUBB3 PAM50 Os_time OS_event RFS_time
##
## 1 TCGA~ TNBC   3.37  0     0     5.94 Basal     967        1       NA
## 2 TCGA~ TNBC   4.97  3.39  0     6.00 Basal     584        0       NA
## 3 TCGA~ TNBC   4.77  0     0     5.04 Basal    2654        0       NA
## 4 TCGA~ TNBC   4.19  3.74  2.84  5.13 Basal     754        1       NA
## 5 TCGA~ TNBC   0     0     0     5.65 Basal    2048        0     2048
## 6 TCGA~ TNBC   5.34  0     4.07  6.04 Basal    1027        0     1027
## # ... with 12 more variables: RFS_event , age , ER ,
## #   PR , gender , HER2 , Margin_status , Node ,
## #   M_stage , N_stage , T_stage , `Pathologic stage`
require(cowplot)
调整清洗数据至想要的格式
require(tidyverse)
require(ggplot2)
require(ggsci)
## Loading required package: ggsci
mydata<-data %>%
  ## 基因表达数据gather,gather的范围应调整
  gather(key="gene",value="Expression",CCL14:TUBB3) %>%
  ##
  dplyr::select(ID,gene,Expression,everything())
head(mydata)
## # A tibble: 6 x 20
##   ID    gene  Expression group PAM50 Os_time OS_event RFS_time RFS_event
##
## 1 TCGA~ CCL14       3.37 TNBC  Basal     967        1       NA        NA
## 2 TCGA~ CCL14       4.97 TNBC  Basal     584        0       NA        NA
## 3 TCGA~ CCL14       4.77 TNBC  Basal    2654        0       NA        NA
## 4 TCGA~ CCL14       4.19 TNBC  Basal     754        1       NA        NA
## 5 TCGA~ CCL14       0    TNBC  Basal    2048        0     2048         0
## 6 TCGA~ CCL14       5.34 TNBC  Basal    1027        0     1027         0
## # ... with 11 more variables: age , ER , PR , gender ,
## #   HER2 , Margin_status , Node , M_stage ,
## #   N_stage , T_stage , `Pathologic stage`
绘制简单箱线图
P<-mydata %>%
   ## 确定x,y
   ggplot(aes(x = gene, y = Expression, fill = group)) +
        geom_boxplot(alpha=0.7) +
        scale_y_continuous(name = "Expression")+
        scale_x_discrete(name = "Gene") +
        ggtitle("Boxplot of hub gene") +
        theme_bw() +
        theme(plot.title = element_text(size = 14, face =  "bold"),
              text = element_text(size = 12),
              axis.title = element_text(face="bold"),
              axis.text.x=element_text(size = 11))
P
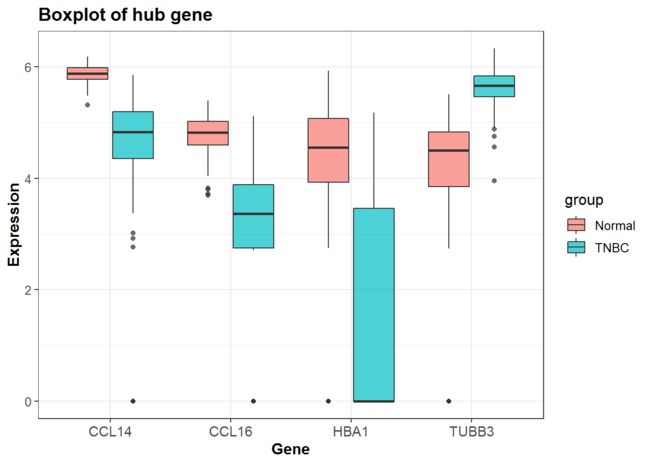
image.png
ggsci调色
调用scale_fill_lancet,调色lancet配色
p2<-P+scale_fill_lancet()
p2
#ggsave(p2,filename = "hub_gene_boxplot.pdf",width = 5,height = 5)
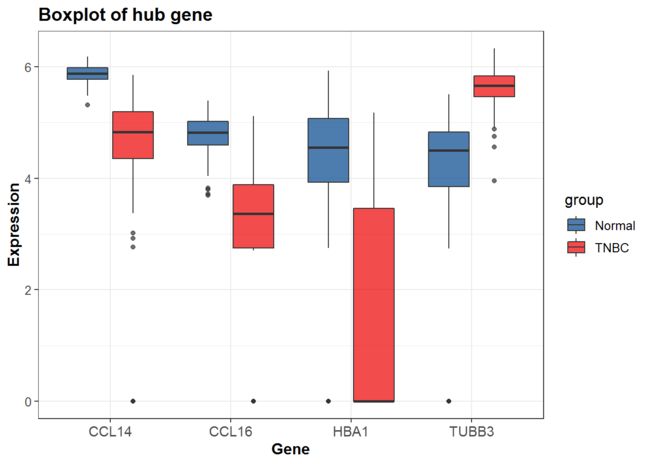
image.png
分面图形
facet_wrap()
P<-mydata %>%
   ## 确定x,y
   ggplot(aes(x = group, y = Expression, fill = group)) +
        geom_boxplot(alpha=0.7) +
        scale_y_continuous(name = "Expression")+
        scale_x_discrete(name = "group") +
        ggtitle("Boxplot of hub gene") +
        theme_bw() +
        theme(plot.title = element_text(size = 14, face =  "bold"),
              text = element_text(size = 12),
              axis.title = element_text(face="bold"),
              axis.text.x=element_text(size = 11))
P
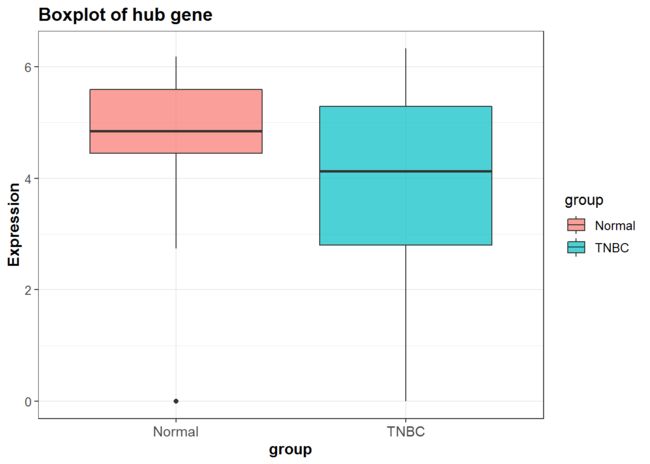
image.png
p3<-P+scale_fill_lancet()+facet_wrap(~gene)
p3
#ggsave(p3,filename = "hub_gene_boxplot_facet.pdf",width = 5,height = 5)
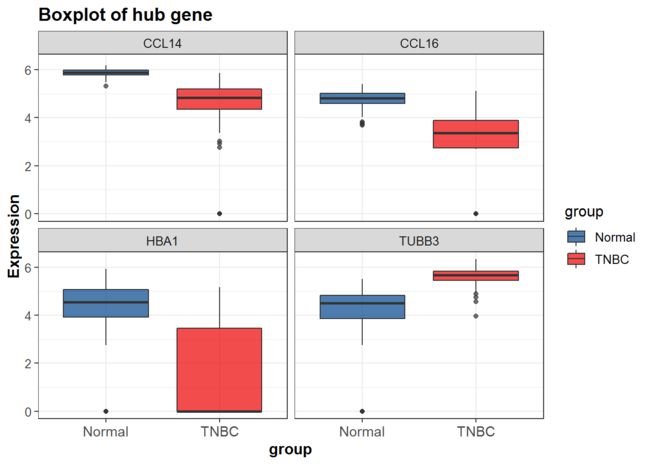
image.png
加入其它变量并分面-PAM50
p<-mydata %>%
  ## 筛选数据,选定x,y
  filter(group=="TNBC" & PAM50!="NA") %>%
  ggplot(aes(x = PAM50, y = Expression, fill = PAM50)) +
        geom_boxplot(alpha=0.7) +
        scale_y_continuous(name = "Expression")+
        scale_x_discrete(name = "PAM50") +
        ggtitle("Boxplot of hub gene") +
        theme_bw() +
        theme(plot.title = element_text(size = 14, face =  "bold"),
              text = element_text(size = 12),
              axis.title = element_text(face="bold"),
              axis.text.x=element_text(size = 11))
p+scale_fill_lancet()+
  facet_wrap(~gene)##分面变量
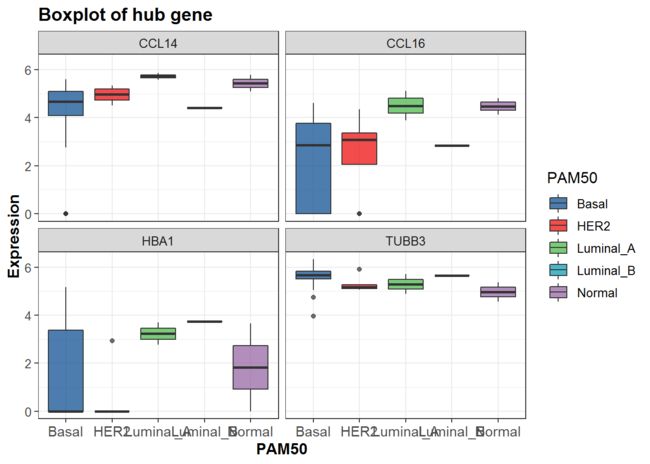
image.png
for循环实现批量绘图
- for循环:命名空对象list 配合do.call函数
library(gridExtra)
##
## Attaching package: 'gridExtra'
## The following object is masked from 'package:dplyr':
##
##     combine
library(ggplot2)
p <- list()
genename<-hubgene
for (j in genename) {
  p[[j]] <- ggplot(data=data, aes_string(x=group, y=j)) +
            geom_boxplot(alpha=0.7,aes(fill=group)) +
            scale_y_continuous(name = "Expression")+
            scale_x_discrete(name = j) +
            ggtitle(paste0("boxlot of ",j) ) +##ggtitle指定
            theme_bw() +
            theme(plot.title = element_text(size = 14, face =  "bold"),
            text = element_text(size = 12),
            axis.title = element_text(face="bold"),
            axis.text.x=element_text(size = 11))+
            scale_fill_lancet()
  #ggsave(sprintf("boxplot%s.pdf",j),width=5,height=5,onefile=T)
}
do.call(grid.arrange, c(p, ncol=2))
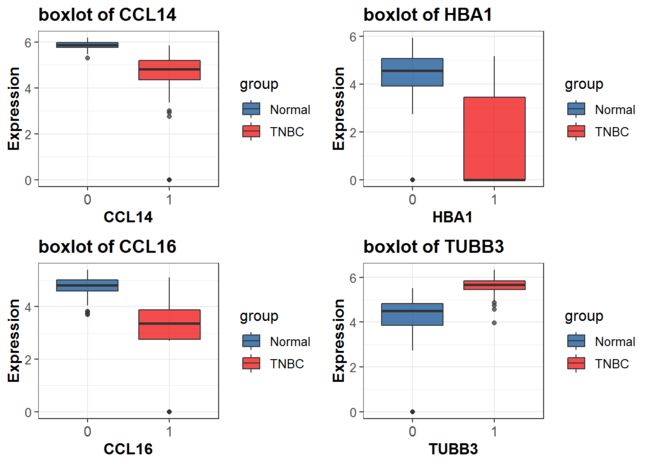
image.png