《Matlab语法》第8章 二维图形可视化
第8章 二维图形可视化
- (8.1) plot
- (8.2) fplot
- (8.3) fimplicit
- (8.4) yyaxis
- (8.5) stackedplot
- (8.6) semilogx
- (8.7) semilogy
- (8.8) loglog
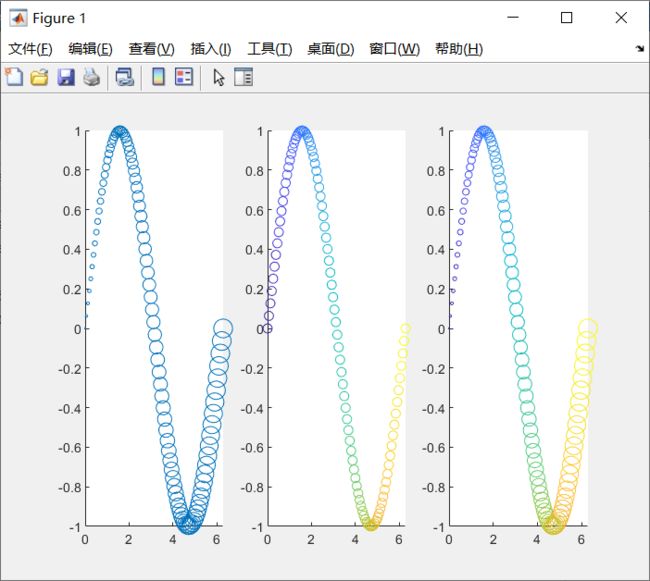
- (8.9) scatter
- (8.10) pie
- (8.11) bar
- (8.12) barh
- (8.13) histogram
- (8.14) stem
- (8.15) stairs
- (8.16) errorbar
- (8.17) polarplot
- (8.18) ezpolar
- (8.19) compass
- (8.20) polarscatter
- (8.21) polarhistogram
- (8.22) contour
- (8.23) fcontour
- (8.24) contourf
- (8.25) quiver
- (8.26) area
(8.1) plot
| 线型 | 含义 | 线型 | 含义 |
|---|---|---|---|
- |
实线(默认) | -- |
虚线 |
: |
点线 | -. |
点划线 |
| 颜色 | 含义 | 颜色 | 含义 |
|---|---|---|---|
r |
红色 | g |
绿色 |
b |
蓝色 | y |
黄色 |
m |
品红 | c |
青蓝 |
w |
白色 | k |
黑色 |
| 标记 | 含义 | 标记 | 含义 |
|---|---|---|---|
o |
圆圈 | + |
加号 |
* |
星号 | . |
点 |
x |
叉号 | s |
正方形 |
d |
菱形 | ^ |
上三角形 |
v |
下三角形 | > |
右三角形 |
< |
左三角形 | p |
五角星 |
h |
六角星 |
| Color | 含义 | Color | 含义 |
|---|---|---|---|
r或red或[1 0 0] |
红色 | g或green或[0 1 0] |
绿色 |
b或blue或[0 0 1] |
蓝色 | y或yellow或[1 1 0] |
黄色 |
m或magenta或[1 0 1] |
品红 | c或cyan或[0 1 1] |
青蓝 |
w或white或[1 1 1] |
白色 | k或black或[0 0 0] |
黑色 |
| LineStyle | 含义 | LineStyle | 含义 |
|---|---|---|---|
- |
实线(默认) | -- |
虚线 |
: |
点线 | -. |
点划线 |
| Marker | 含义 | Marker | 含义 |
|---|---|---|---|
o |
圆圈 | + |
加号 |
* |
星号 | . |
点 |
x |
叉号 | s或square |
正方形 |
d或diamond |
菱形 | ^ |
上三角形 |
v |
下三角形 | > |
右三角形 |
< |
左三角形 | p或pentagram |
五角星 |
h或hexagram |
六角星 |
| 其他属性 | 含义 | 其他属性 | 含义 |
|---|---|---|---|
LineWidth |
设置线宽(以磅为单位) | MarkerSize |
设置标记大小 |
MarkerEdgeColor |
设置标记轮廓颜色 | MarkerFaceColor |
设置标记填充颜色 |
XData |
记录横坐标数据的向量 | YData |
记录纵坐标数据的向量 |
ZData |
记录竖坐标数据的向量 | ThetaData |
记录角度坐标数据的向量 |
RData |
记录半径坐标的向量 |
clc;clear;
x = linspace(0,2*pi,100);
y1 = sin(x);
y2 = cos(x);
y3 = y1.*y2;
plot(x,y1,'-r*',x,y2,'-.gp',x,y3,'--bo');
legend('y=sinx','y=cosx','y=sinx*cosx');
(8.2) fplot
fplot(f_x,[xmin,xmax]); %绘制f=f(x)的x在[xmin,xmax]上的图像
fplot(x_t,y_t,[tmin,tmax]); %绘制f=f(x(t),y(t))的t在[xmin,xmax]上的图像
clc;clear;
hold on;
axis equal;
fplot(@(x) sin(x),[0,2*pi],'-r*','LineWidth',2);
fplot(@(x) cos(x),[0,2*pi],'-.gp','LineWidth',2);
x = @(t) cos(t);
y = @(t) sin(t);
fplot(x,y,[0,2*pi],'--bo','LineWidth',2);
(8.3) fimplicit
fimplicit(f,[xmin,xmax,ymin,ymax]); %绘制f(x,y)=0的x在[xmin,xmax]、y在[ymin,ymax]上的图像
例:在 x ∈ [ − 2 , 2 ] , y ∈ [ − 2 , 2 ] x\in[-2,2],y\in[-2,2] x∈[−2,2],y∈[−2,2]上画出标准椭圆 x 2 + y 2 = 1 x^2+y^2=1 x2+y2=1、标准双曲线 x 2 − y 2 = 1 x^2-y^2=1 x2−y2=1、标准抛物线 x = y 2 x=y^2 x=y2的曲线。提示:
refline(slope,intercept); %slope为直线的斜率,intercept为直线的截距
refline(slope); %输入参数slope=[a,b],添加的直线为y=ax+b
clc;clear;
hold on;
axis equal;
axis([-2,2,-2,2]);
f_Ellipse = @(x,y) x.^2 + y.^2 - 1;
f_Hyperbola = @(x,y) x.^2 - y.^2 - 1;
f_Parabola = @(x,y) x - y.^2;
fimplicit(f_Ellipse,[-2,2,-2,2]);
fimplicit(f_Hyperbola,[-2,2,-2,2]);
fimplicit(f_Parabola,[-2,2,-2,2]);
refline([0,0]); %x轴
plot([0,0],[-2,2]); %y轴
(8.4) yyaxis
clc;clear;
x = linspace(0,2*pi,100);
y1 = sin(x);
y2 = 10.^x;
yyaxis left;
plot(x,y1);
yyaxis right;
semilogy(x,y2);
(8.5) stackedplot
clc;clear;
x = linspace(0,2*pi,40);
Y = [sin(x);cos(x);sin(x).*cos(x)]';
h = stackedplot(x,Y);
%添加标题
h.Title = '堆叠绘图';
%添加网格
h.GridVisible = 'on';
%设置坐标轴的名称
h.XLabel = 'x';
h.DisplayLabels = {'sinx','cosx','sinx*cosx'};
%设置坐标轴的范围
h.XLimits = [0,2*pi];
h.AxesProperties(1).YLimits = [-1,1];
h.AxesProperties(2).YLimits = [-1,1];
h.AxesProperties(3).YLimits = [-0.5,0.5];
%设置曲线的属性
h.LineProperties(1).Color = 'r';
h.LineProperties(1).MarkerFaceColor = 'g';
h.LineProperties(1).MarkerEdgeColor = 'b';
h.LineProperties(1).LineStyle = '-';
h.LineProperties(1).LineWidth = 2;
h.LineProperties(1).Marker = '*';
h.LineProperties(1).MarkerSize = 5;
h.LineProperties(1).PlotType = 'plot';
h.LineProperties(2).Color = 'g';
h.LineProperties(2).MarkerFaceColor = 'b';
h.LineProperties(2).MarkerEdgeColor = 'r';
h.LineProperties(2).LineStyle = '-.';
h.LineProperties(2).LineWidth = 2;
h.LineProperties(2).Marker = 'p';
h.LineProperties(2).MarkerSize = 5;
h.LineProperties(2).PlotType = 'stairs';
h.LineProperties(3).Color = 'b';
h.LineProperties(3).MarkerFaceColor = 'r';
h.LineProperties(3).MarkerEdgeColor = 'g';
h.LineProperties(3).LineStyle = '--';
h.LineProperties(3).LineWidth = 2;
h.LineProperties(3).Marker = 'o';
h.LineProperties(3).MarkerSize = 5;
h.LineProperties(3).PlotType = 'scatter';
%设置图例
h.AxesProperties(1).LegendVisible = 'on';
h.AxesProperties(1).LegendLabels = {'y=sinx'};
h.AxesProperties(1).LegendLocation = 'southeast';
h.AxesProperties(2).LegendVisible = 'on';
h.AxesProperties(2).LegendLabels = {'y=cosx'};
h.AxesProperties(2).LegendLocation = 'northeast';
h.AxesProperties(3).LegendVisible = 'on';
h.AxesProperties(3).LegendLabels = {'y=sinx*cosx'};
h.AxesProperties(3).LegendLocation = 'north';
(8.6) semilogx
clc;clear;
x = 0:1000;
y = log(x);
subplot(121);
plot(x,y);
title('普通坐标系');
subplot(122);
semilogx(x,y);
title('x轴为常用对数刻度的坐标系');
(8.7) semilogy
clc;clear;
x = linspace(0,2,100);
y = exp(x);
subplot(121);
plot(x,y);
title('普通坐标系');
subplot(122);
semilogy(x,y);
title('y轴为常用对数刻度的坐标系');
(8.8) loglog
例:将一组实验数据GrPr=[458934.6 128178.6 81973.53 47893.61 1903764 1523845 241316.5 586097.9 811834.9 1291265],Nu=[12.77 9.53 9.42 8.02 17.51 17.01 11.39 15.16 13.1013 15.54],拟合成实验关联式: N u = C ( G r P r ) n Nu=C(GrPr)^n Nu=C(GrPr)n(两边取自然对数得: l n ( N u ) = l n ( C ) + n l n ( G r P r ) ln(Nu)=ln(C)+nln(GrPr) ln(Nu)=ln(C)+nln(GrPr),比较适合用双自然对数坐标系)。
clc;clear;
GrPr=[458934.6 128178.6 81973.53 47893.61 1903764 1523845 241316.5 586097.9 811834.9 1291265];
Nu=[12.77 9.53 9.42 8.02 17.51 17.01 11.39 15.16 13.1013 15.54];
loglog(GrPr,Nu,'*','MarkerSize',8);
hold on;
p = polyfit(log(GrPr),log(Nu),1);
x = min(GrPr):max(GrPr);
y = exp(polyval(p,log(x)));
loglog(x,y);
xlabel('GrPr');
ylabel('Nu');
(8.9) scatter
clc;clear;
x = linspace(0,2*pi,100);
y = sin(x);
scatterSize = linspace(1,150,length(x)); %大小不能以0开始
scatterColor = linspace(0,10,length(x));
subplot(131);
scatter(x,y,scatterSize); %变大小
subplot(132);
scatter(x,y,[],scatterColor); %变颜色
subplot(133)
scatter(x,y,scatterSize,scatterColor); %变大小和颜色
(8.10) pie
例:一个公司有一批钢材需要购进,9Mn2V预计消费1.5万,9SiCr预计消费2.0万,Cr2预计消费4.0万,Cr12预计消费2.5万。现在需要统计各部分钢材消费的占比,并且突出显示消费占比最大和最小的钢材种类。
clc;clear;
prices = [1.5 2.0 4.0 2.5];
explode = [1 0 1 0]; %0表示不突出显示,1表示突出显示
pie(prices,explode);
legend('9Mn2V','9SiCr','Cr2','Cr12','Location','SouthWestOutside');
(8.11) bar
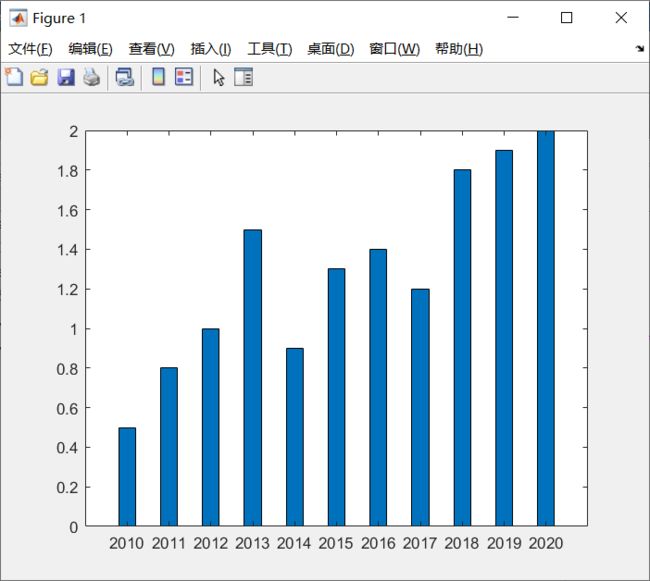
例:某公司在2010~2020年每年的营业额为:0.5、0.8、1.0、1.5、0.9、1.3、1.4、1.2、1.8、1.9、2.0(单位:亿元),用竖直条形图来显示该公司的营业额随年份的走向。
clc;clear;
%x = 2010:2020;
x = linspace(1,11,11);
y = [0.5 0.8 1.0 1.5 0.9 1.3 1.4 1.2 1.8 1.9 2.0];
bar(x,y,0.4); %将各条形的宽度设置为各条形可用总空间的40%
set(gca,'XTickLabel',{'2010','2011','2012','2013','2014','2015','2016','2017','2018','2019','2020'});
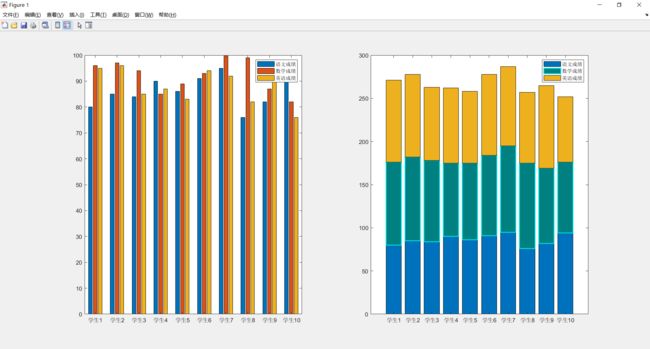
例:用竖直条形图记录10个学生的语、数、外成绩。
clc;clear;
chinese = [80 85 84 90 86 91 95 76 82 94];
math = [96 97 94 85 89 93 100 99 87 82];
english = [95 96 85 87 83 94 92 82 96 76];
x = linspace(1,10,10);
y = [chinese;math;english]';
subplot(121);
bar(x,y,'grouped'); %默认
set(gca,'XTickLabel',{'学生1','学生2','学生3','学生4','学生5','学生6','学生7','学生8','学生9','学生10'});
legend('语文成绩','数学成绩','英语成绩');
subplot(122);
h = bar(x,y,'stacked');
set(h(2),'FaceColor',[0 .5 .5],'EdgeColor',[0 .9 .9],'LineWidth',1.5); %改变第二组的颜色和线宽
set(gca,'XTickLabel',{'学生1','学生2','学生3','学生4','学生5','学生6','学生7','学生8','学生9','学生10'});
legend('语文成绩','数学成绩','英语成绩');
(8.12) barh
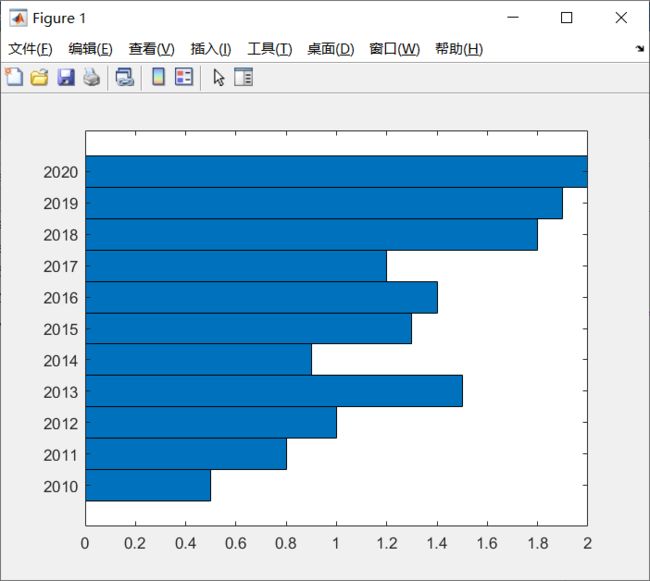
例:某公司在2010~2020年每年的营业额为:0.5、0.8、1.0、1.5、0.9、1.3、1.4、1.2、1.8、1.9、2.0(单位:亿元),用水平条形图来显示该公司的营业额随年份的走向。
clc;clear;
x = linspace(1,11,11);
y = [0.5 0.8 1.0 1.5 0.9 1.3 1.4 1.2 1.8 1.9 2.0];
barh(x,y,1);
set(gca,'YTickLabel',{'2010','2011','2012','2013','2014','2015','2016','2017','2018','2019','2020'});
例:用水平条形图记录10个学生的语、数、外成绩。
clc;clear;
chinese = [80 85 84 90 86 91 95 76 82 94];
math = [96 97 94 85 89 93 100 99 87 82];
english = [95 96 85 87 83 94 92 82 96 76];
x = linspace(1,10,10);
y = [chinese;math;english]';
subplot(121);
barh(x,y,'grouped'); %默认
set(gca,'YTickLabel',{'学生1','学生2','学生3','学生4','学生5','学生6','学生7','学生8','学生9','学生10'});
legend('语文成绩','数学成绩','英语成绩');
subplot(122);
h = barh(x,y,'stacked');
set(gca,'YTickLabel',{'学生1','学生2','学生3','学生4''学生5','学生6','学生7','学生8','学生9','学生10'});
legend('语文成绩','数学成绩','英语成绩');
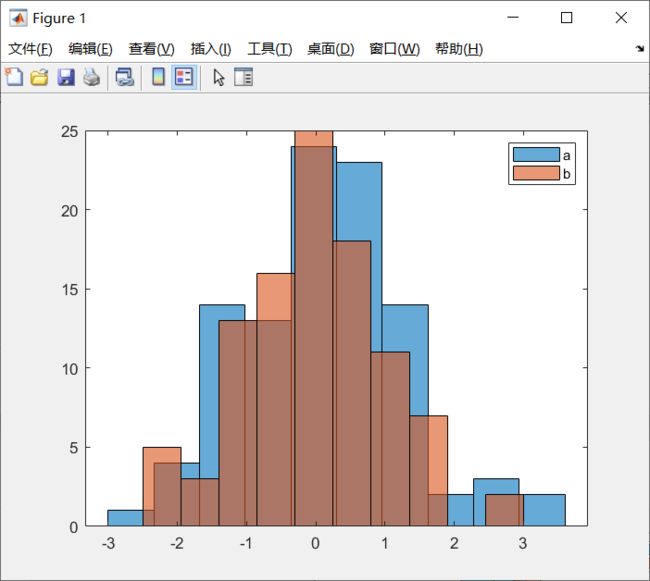
(8.13) histogram
clc;clear;
a = randn(100,1);
b = randn(100,1);
histogram(a,10);
hold on;
histogram(b,10);
legend('a','b');
(8.14) stem
clc;clear;
x = linspace(0,2*pi,50);
y1 = sin(x);
y2 = sin(x+pi/2);
y3 = sin(x+pi);
hold on;
axis tight;
stem(x,y1);
stem(x,y2,'fill'); %将火柴头填充
stem(x,y3,'diamond','fill'); %菱形填充火柴头
(8.15) stairs
clc;clear;
x = linspace(0,4*pi,20);
y = sin(x);
stairs(x,y,'LineWidth',2,'Marker','d','MarkerFaceColor','c');
(8.16) errorbar
例:A地1-6月份降雨量的平均值分别为12、11、7、7、6和5,各月降雨量的方差分别为0.5、0.4、0.3、1、0.3和0.5;B地1-6月份降雨量的平均值分别为10、8、5、4、3和3,各月降雨量的方差分别为0.4、0.3、0.4、0.6、0.3和0.5。
clc;clear;
x = 1:6; %月份
y1 = [12,11,7,7,6,5]; %A地的降雨量
var1 = [0.5,0.4,0.3,1,0.3,0.5]; %A地的方差
y2 = [10,8,5,4,3,3]; %B地的降雨量
var2 = [0.4,0.3,0.4,0.6,0.3,0.5]; %B地的方差
errorbar(x,y1,var1,'r-o','vertical'); %竖直误差条(默认)
hold on;
errorbar(x,y2,var2,'b-s','horizontal'); %水平误差条,还可以为both,代表水平、竖直误差条同时出现
xlabel('月份');ylabel('降雨量');
legend('A地','B地');
(8.17) polarplot
clc;clear;
theta = 0:0.01:2*pi;
rho = sin(2 * theta).*cos(2 * theta);
polarplot(theta,rho); %polar函数的升级版
(8.18) ezpolar
ezpolor(f,[thetamin,thetamax]); %绘制rho=f(theta)的theta在[thetamin,thetamax]上的图像
clc;clear;
ezpolar('1 - sin(theta)',[0,2*pi]);
(8.19) compass
clc;clear;
theta = linspace(pi/4,2*pi,10);
rho = linspace(5,20,10);
[u,v] = pol2cart(theta,rho);
c = compass(u,v); %以(0,0)为起点、(u,v)为终点绘制箭头
%着重标出第一个箭头
c(1).LineWidth = 2;
c(1).Color = 'r';
(8.20) polarscatter
clc;clear;
theta = pi/4:pi/4:2*pi;
rho = [19 6 12 18 16 11 15 15];
size = 100 * [6 15 20 3 15 3 6 40];
color = [1 2 2 2 1 1 2 1];
polarscatter(theta,rho,size,color,'filled');
(8.21) polarhistogram
clc;clear;
theta = 0 + (2*pi - 0) * rand(20,1); %生成[a,b]上的m×n的随机数:r=a+(b-a)*rand(m,n);
polarhistogram(theta,10); %polarhistogram是rose的升级版
(8.22) contour
clc;clear;
[X,Y,Z] = peaks;
contour(X,Y,Z,5,'--','LineWidth',3,'ShowText','on'); %绘制Z的5条等高线并显示标签
(8.23) fcontour
fcontour(f,[xmin,xmax,ymin,ymax]); %绘制z=f(x,y)的x在[xmin,xmax]、y在[ymin,ymax]上的等高线图
clc;clear;
f = @(x,y) exp(-(x/3).^2-(y/3).^2) + exp(-(x+2).^2-(y+2).^2);
h = fcontour(f);
h.LineWidth = 2;
h.LevelList = [1 0.9 0.8 0.2 0.1];
h.Fill = 'on';
colorbar;
(8.24) contourf
clc;clear;
[X,Y,Z] = peaks(50);
contourf(X,Y,Z,[2 3 4],'ShowText','on','LineWidth',2);
(8.25) quiver
clc;clear;
[X,Y,Z] = peaks(20);
contour(X,Y,Z,15);
[u,v] = gradient(Z);
hold on;
quiver(X,Y,u,v); %在(X,Y)处绘制向量场图,(u,v)为速度分量
(8.26) area
clc;clear;
x = linspace(0,2*pi,100);
y = sin(x);
h = area(x,y);
h.FaceColor = 'cyan';
h.EdgeColor = 'r';
h.LineWidth = 2;
h.FaceAlpha = 0.5; %面透明度,值为1表示不透明,值为0表示完全透明
h.EdgeAlpha = 0.5; %边透明度,值为1表示不透明,值为0表示完全透明
h.LineStyle = '--';
h.LineWidth = 2;
h.AlignVertexCenters = 'on'; %锐化垂直线和水平线 绘制Y对X的图
参 考 资 料 来 源 参考资料来源 参考资料来源
- 《科学计算与MATLAB语言》.刘卫国.蔡旭晖.吕格莉.何小贤.中国大学MOOC.
- 《MATLAB软件与基础数学实验》.李换琴.朱旭.王勇茂.籍万新.西安交通大学出版社.
- 《MATLAB R2018a完全自学一本通》.刘浩.韩晶.电子工业出版社.
- 《MATLAB工程与科学绘图》.周博.薛世峰.清华大学出版社.
- 《Matlab教程 - 图像处理(第1讲)》.正月点灯笼.https://www.bilibili.com.
- 《Matlab教程 - 图像处理(第2讲:喵去哪了)》.正月点灯笼.https://www.bilibili.com.
- 《MATLAB从入门到秃头》.古德谓尔.https://www.bilibili.com.
- 《自动控制原理实验教程》.巨林仓.西安交通大学出版社.
博 客 创 作 : A i d e n L e e 博客创作:Aiden\ Lee 博客创作:Aiden Lee
特别声明:文章仅供学习参考,转载请注明出处,严禁盗用!


