Python实战:使用线性回归预测房价
房价大概是我们中国每一个普通老百姓比较关心的问题,我们想预测特定房子的价值,预测依据是房屋面积。

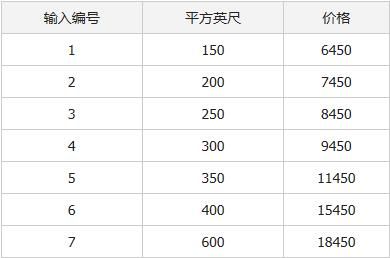
我们有下面的数据集:
在线性回归中,我们都知道必须在数据中找出一种线性关系,以使我们可以得到θ0和θ1。 我们的假设方程式如下所示:
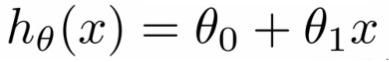
其中: hθ(x)是关于特定平方英尺的价格值(我们要预测的值),(意思是价格是平方英尺的线性函数); θ0是一个常数; θ1是回归系数。
那么现在开始编程:
步骤1
打开文本编辑器,并命名为predict_house_price.py。 我们在我们的程序中要用到下面的包,所以把下面代码复制到predict_house_price.py文件中去。
1 # Required Packages
2 import matplotlib.pyplot as plt
3 import numpy as np
4 import pandas as pd
5 from sklearn import datasets, linear_model
运行一下你的代码。如果程序没错,那步骤1基本做完了。如果你遇到了某些错误,这意味着你丢失了一些包,所以回头去看看包的页面。 安装博客文章中所有的包,再次运行你的代码。这次希望你不会遇到任何问题。
步骤2
把数据存储成一个.csv文件,名字为input_data.csv 所以让我们写一个函数把数据转换为X值(平方英尺)、Y值(价格)
1 # Function to get data
2 def get_data(file_name):
3 data = pd.read_csv(file_name)
4 X_parameter = []
5 Y_parameter = []
6 for single_square_feet ,single_price_value in zip(data['square_feet'],data['price']):
7 X_parameter.append([float(single_square_feet)])
8 Y_parameter.append(float(single_price_value))
9 return X_parameter,Y_parameter
第3行:将.csv数据读入Pandas数据帧。
第6-9行:把Pandas数据帧转换为X_parameter和Y_parameter数据,并返回他们。
所以,让我们把X_parameter和Y_parameter打印出来:
[[150.0], [200.0], [250.0], [300.0], [350.0], [400.0], [600.0]]
[6450.0, 7450.0, 8450.0, 9450.0, 11450.0, 15450.0, 18450.0]
[Finished in 0.7s]
脚本输出: [[150.0], [200.0], [250.0], [300.0], [350.0], [400.0], [600.0]] [6450.0, 7450.0, 8450.0, 9450.0, 11450.0, 15450.0, 18450.0] [Finished in 0.7s]
步骤3
现在让我们把X_parameter和Y_parameter拟合为线性回归模型。我们要写一个函数,输入为X_parameters、Y_parameter和你要预测的平方英尺值,返回θ0、θ1和预测出的价格值。
在学习过程中有什么不懂得可以加我的
python学习交流扣扣qun,784758214
群里有不错的学习视频教程、开发工具与电子书籍。
与你分享python企业当下人才需求及怎么从零基础学习好python,和学习什么内容
1 # Function for Fitting our data to Linear model
2 def linear_model_main(X_parameters,Y_parameters,predict_value):
3
4 # Create linear regression object
5 regr = linear_model.LinearRegression()
6 regr.fit(X_parameters, Y_parameters)
7 predict_outcome = regr.predict(predict_value)
8 predictions = {}
9 predictions['intercept'] = regr.intercept_
10 predictions['coefficient'] = regr.coef_
11 predictions['predicted_value'] = predict_outcome
12 return predictions
第5-6行:首先,创建一个线性模型,用我们的X_parameters和Y_parameter训练它。
第8-12行:我们创建一个名称为predictions的字典,存着θ0、θ1和预测值,并返回predictions字典为输出。
所以让我们调用一下我们的函数,要预测的平方英尺值为700。
1 X,Y = get_data('input_data.csv')
2 predictvalue = 700
3 result = linear_model_main(X,Y,predictvalue)
4 print "Intercept value " , result['intercept']
5 print "coefficient" , result['coefficient']
6 print "Predicted value: ",result['predicted_value']
脚本输出:Intercept value 1771.80851064 coefficient [ 28.77659574] Predicted value: [ 21915.42553191] [Finished in 0.7s]
这里,Intercept value(截距值)就是θ0的值,coefficient value(系数)就是θ1的值。 我们得到预测的价格值为21915.4255——意味着我们已经把预测房子价格的工作做完了!
为了验证,我们需要看看我们的数据怎么拟合线性回归。所以我们需要写一个函数,输入为X_parameters和Y_parameters,显示出数据拟合的直线。
1 # Function to show the resutls of linear fit model
2 def show_linear_line(X_parameters,Y_parameters):
3 # Create linear regression object
4 regr = linear_model.LinearRegression()
5 regr.fit(X_parameters, Y_parameters)
6 plt.scatter(X_parameters,Y_parameters,color='blue')
7 plt.plot(X_parameters,regr.predict(X_parameters),color='red',linewidth=4)
8 plt.xticks(())
9 plt.yticks(())
10 plt.show()
那么调用一下show_linear_line函数吧:
1 show_linear_line(X,Y)
脚本输出:

对Python感兴趣或者是正在学习的小伙伴,可以加入我们的Python学习扣qun:784758214,看看前辈们是如何学习的!从基础的python脚本到web开发、爬虫、django、数据挖掘等,零基础到项目实战的资料都有整理。送给每一位python的小伙伴!每天都有大牛定时讲解Python技术,分享一些学习的方法和需要注意的小细节,点击加入我们的 python学习者聚集地
以上就是本文关于Python编程实现使用线性回归预测数据的全部内容,觉得文章还可以的话不妨收藏起来慢慢看,有任何意见或者看法欢迎大家评论!