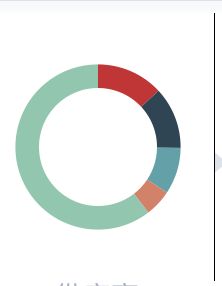
1. width 和 height 设置的不对的时候,会出现边框线如图所示:
解决办法:Echarts/index.js文件中
2. 折线区域图设置为渐变色,去掉节点,变成平滑
series: [{
        name: 'Clouds',
        type: 'line',
        // 变成平滑线
        smooth:true,
        //这句就是去掉点的
         symbol:'none',
        data: [5, 7, 13, 20, 30],
        // 设置为填充样式,把这句去掉的话,即为普通的折线图
areaStyle: {
                        normal: {
                            color: {
                                type: 'linear',
                                x: 0,
                                y: 0,
                                x2: 0,
                                y2: 1,
                                colorStops: [
                                    {
                                        offset: 0, color: 'rgba(6,81,222, 0.5)' // 100% 处的颜色
                                    },
                                    {
                                        offset: 0.5, color: 'rgba(6,81,222, 0.2)' // 50% 处的颜色
                                    },
                                    {
                                        offset: 1, color: 'rgba(253,253,253,0.17)' // 0% 处的颜色
                                    },

                                ],
                            }
                        }
                    },
        // 设置为渐变色, 此处设置的是针对网页的
        itemStyle: {
        normal: {
            color: new echarts.graphic.LinearGradient(
                0, 0, 0, 1,
                [
                    {offset: 0, color: 'red'},
                    {offset: 0.5, color: 'pink'},
                    {offset: 1, color: '#ddd'}
                ]
            )
        }
    }
}]
3. 环图某一个项,设置为渐变色
data:[
                        {value:335, name:'正面消息', selected: true, itemStyle: normal: {
                color: {
                    type: 'linear',
                    x: 0,
                    y: 0,
                    x2: 0,
                    y2: 1,
                    colorStops: [
                        {
                            offset: 0, color: 'rgba(250,79,125,1)' // 100% 处的颜色
                        },
                        {
                            offset: 1, color: 'rgba(244,39,71,1)' // 0% 处的颜色
                        },

                    ]
                },
            }},
                        {value:180, name:'负面消息', itemStyle: {normal: 'green'}},
                    ]
4.android 打包后,所有的图表显示不出来
1./node_modules/native-echarts/src/components/Echarts/ 目录下的tpl.html 拷贝一份
2./android/app/src/main 创建 assets文件夹
3.把第一步拷贝的文件放到第二步创建的assets文件夹下
4.进入Echarts文件(/node_modules/native-echarts/src/components/Echarts/index) 把WebView的source改为
source={{uri: 'file:///android_asset/tpl.html'}}
5.修改图例颜色
react-native-echarts 修改图例颜色首先要修改itemStyle的颜色
6.解决频繁刷新
进入Echarts文件(/node_modules/native-echarts/src/components/Echarts/index)
shouldComponentUpdate(nextProps, nextState) {
        const thisProps = this.props || {}
        nextProps = nextProps || {}
        if (Object.keys(thisProps).length !== Object.keys(nextProps).length) {
            return true
        }
        for (const key in nextProps) {
            if (JSON.stringify(thisProps[key]) != JSON.stringify(nextProps[key])) {
// console.log('props', key, thisProps[key], nextProps[key])
                return true
            }
        }
        return false
    }

    componentWillReceiveProps(nextProps) {
        if(nextProps.option !== this.props.option) {

// 解决数据改变时页面闪烁的问题
            this.refs.chart.injectJavaScript(renderChart(nextProps,false))
        }
    }
修改WebView的属性injectedJavaScript
injectedJavaScript = {renderChart(this.props,true)}
进入renderChart文件(/node_modules/native-echarts/src/components/Echarts/renderChart)
export default function renderChart(props, isFirst) {
    const height = props.height || 400;
    if (isFirst) {
        return `
        document.getElementById('main').style.height = "${height}px";
    myChart = echarts.init(document.getElementById('main'));
    myChart.setOption(${toString(props.option)});

  `
    } else {
        return `
    document.getElementById('main').style.height = "${height}px";
    myChart.setOption(${toString(props.option)});

  `
    }
7. 折线图节点添加点击事件
进入renderChart文件(/node_modules/native-echarts/src/components/Echarts/renderChart)
添加
myChart.on('click' , function (params) {
        window.postMessage(params.dataIndex)
    });
添加后
if (isFirst) {
        return `
        document.getElementById('main').style.height = "${height}px";
    myChart = echarts.init(document.getElementById('main'));
    myChart.setOption(${toString(props.option)});
    myChart.on('click' , function (params) {
        window.postMessage(params.dataIndex)
    });
  `
    } else {
        return `
    document.getElementById('main').style.height = "${height}px";
    myChart.setOption(${toString(props.option)});
    myChart.on('click' , function (params) {
        window.postMessage(params.dataIndex)
    });
  `
    }
进入Echart文件(/node_modules/native-echarts/src/components/Echarts/index)
WebView添加属性
onMessage={this.onMessage}
添加事件
// 添加点击事件
    onMessage = (event) => {
        if (this.props.onNodePress) {
            console.log(event.nativeEvent)
            this.props.onNodePress(event.nativeEvent.data)
        }
    }
最终修改后
进入Echarts文件(/node_modules/native-echarts/src/components/Echarts/index)
import React, { Component } from 'react';
import { WebView, View, StyleSheet,Platform } from 'react-native';
import renderChart from './renderChart';
import renderChartNoFirst from './renderChart'
import echarts from './echarts.min';


export default class App extends Component {
// 预防过渡渲染

    shouldComponentUpdate(nextProps, nextState) {
        const thisProps = this.props || {}
        nextProps = nextProps || {}
        if (Object.keys(thisProps).length !== Object.keys(nextProps).length) {
            return true
        }
        for (const key in nextProps) {
            if (JSON.stringify(thisProps[key]) != JSON.stringify(nextProps[key])) {
// console.log('props', key, thisProps[key], nextProps[key])
                return true
            }
        }
        return false
    }

    componentWillReceiveProps(nextProps) {
        if(nextProps.option !== this.props.option) {

// 解决数据改变时页面闪烁的问题
            this.refs.chart.injectJavaScript(renderChart(nextProps,false))
        }
    }

    // 添加点击事件
    onMessage = (event) => {
        if (this.props.onNodePress) {
            console.log(event.nativeEvent)
            this.props.onNodePress(event.nativeEvent.data)
        }
    }

    render() {
        if (Platform.OS == 'android'){
            return (


            );
        }else{
            return (


            );
        }

    }
}
进入renderChart文件(/node_modules/native-echarts/src/components/Echarts/renderChart)
import echarts from './echarts.min';
import toString from '../../util/toString';

var myChart = null;
export default function renderChart(props, isFirst) {
    const height = props.height || 400;
    if (isFirst) {
        return `
        document.getElementById('main').style.height = "${height}px";
    myChart = echarts.init(document.getElementById('main'));
    myChart.setOption(${toString(props.option)});
    myChart.on('click' , function (params) {
        window.postMessage(params.dataIndex)
    });
  `
    } else {
        return `
    document.getElementById('main').style.height = "${height}px";
    myChart.setOption(${toString(props.option)});
    myChart.on('click' , function (params) {
        window.postMessage(params.dataIndex)
    });
  `
    }
}
使用
onChartNodePress(data) {
        console.log(data)
        this.setState({
            selectedNodeIndex: data,
        })
    }

 this.onChartNodePress(data)}
                    />
android 双击图表会缩小
/node_modules/native-echarts/src/components/Echarts/index.js
Line 24
scalesPageToFit={false}

替换为
scalesPageToFit={Platform.OS === 'android'}
