本节我们继续来进行基因家族数据可视化的第3节教程,通过ggplot2绘制一个富有美感的基因结构图&蛋白保守结构域图,喜欢的小伙伴欢迎关注,多多支持,
原文链接:https://mp.weixin.qq.com/s/k1Mtmf5GKI43SdB_DBG7yg
加载R包
pacman::p_load(ggstar,ggtree,treeio,aplot,tidyverse,
               hablar,patchwork,gggenes,ggseqlogo,magrittr)
自定义数据
colors <-c("#E41A1C","#1E90FF","#FF8C00","#4DAF4A","#984EA3",
           "#40E0D0","#FFC0CB","#00BFFF",
           "#FFDEAD","#EE82EE","#00FFFF")
可视化基因结构图
gene结构信息,可以通过gff文件获取
p <- read.delim("gene.xls",header = T) %>%
  as_tibble() %>% convert(num(V2,V3,V4)) %>%
  convert(fct(V5))
   V1    type       V2      V3    V4 V5

 1 A02   exon  8000346 8000409     1 TA1
 2 A02   exon  8000797 8000922     1 TA1
 3 A02   exon  8001037 8001152     1 TA1
 4 A02   exon  8001242 8001330     1 TA1
 5 A02   exon  8001448 8001493     1 TA1
gene <- ggplot() +
  geom_gene_arrow(data=p,aes(xmin = V2, xmax = V3, y = V5,
                             forward =V4 ,fill = type),
                  arrowhead_height = unit(3,"mm"),
                  arrowhead_width = unit(0.8, "mm"))+
  geom_segment(data=p,aes(x = V2, xend = V3, y = V5, yend =V5)) +
  facet_wrap(~ V5, scales = "free", ncol = 1) +theme_genes()+
  scale_fill_brewer(palette="Set2")+
  theme(axis.text.x = element_blank(),axis.ticks.x=element_blank(),
        axis.text.y=element_blank(),legend.title = element_blank())+
  labs(x=NULL,y=NULL)

gene

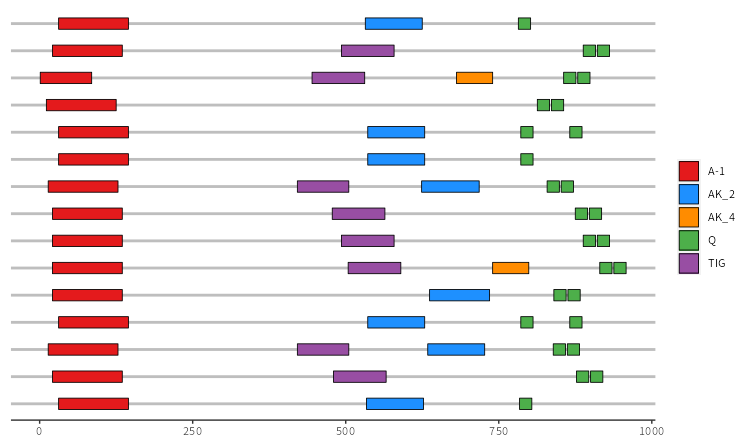
可视化蛋白保守结构域图
保守结构域文件可通过pfam_scan.pl软件将蛋白序列文件与pfam数据库进行比对获得,命令如下
pfam_scan.pl -fasta pep.fa -dir ~/data/pfam/ -outfile pro.xls
pro <- read.delim("pro.xls",header = T,sep="\t") %>%
  as_tibble() %>% convert(fct(gene)) %>%
  ggplot(aes(xmin = start,xmax = end,y=gene,fill = type)) +
  scale_fill_manual(values = colors)+
  geom_gene_arrow(arrowhead_height = unit(3, "mm"),
                  arrowhead_width = unit(0, "mm"))+
  theme_genes()+ylab(NULL)+
  theme(legend.title = element_blank(),axis.text.y=element_blank())

pro
patchwork进行图片拼接
pp2 <- gene + pro +plot_layout(ncol =2,width = c(2.5,2))+
  plot_layout(guides = 'collect')

pp2

此处应该也将进化树拼接上去,为了方便我进行了省略,有需要的可以自行进行添加