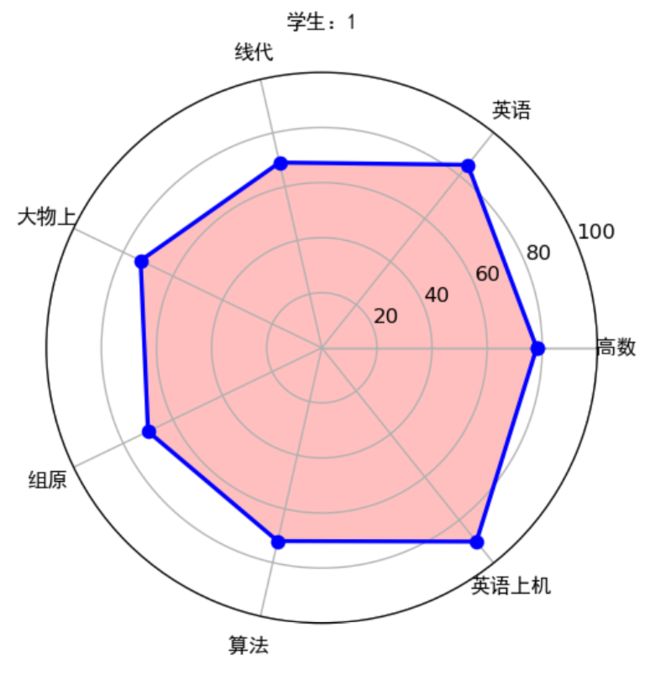
从excel中读取表格值,然后绘制雷达图

from time import clock
import numpy as np
import matplotlib.pyplot as plt
import xlsxwriter
from openpyxl import load_workbook
import os
import time
from PIL import Image
if __name__ == '__main__':
if os.path.exists(r'C:/Users/ASUS/Desktop/result'): # 建立一个文件夹在桌面,文件夹为result
print('result文件夹已经在桌面存在,继续运行程序……')
else:
print('result文件夹不在桌面,新建文件夹result')
os.mkdir(r'C:/Users/ASUS/Desktop/result')
print('文件夹建立成功,继续运行程序')
if os.path.exists(r'C:/Users/ASUS/Desktop/result1'): # 建立一个文件夹在C盘,文件夹为result1
print('result1文件夹已经在桌面存在,继续运行程序……')
else:
print('result1文件夹不在桌面,新建文件夹result1')
os.mkdir(r'C:/Users/ASUS/Desktop/result1')
print('文件夹建立成功,继续运行程序')
wb = load_workbook(filename=r'C:/Users/ASUS/Desktop/b班成绩.xlsx') ##读取路径
ws = wb.get_sheet_by_name("Sheet1") ##读取名字为Sheet1的sheet表
info_id = []
info_first = []
for row_A in range(2, 11): ## 遍历第2行到11行
id = ws.cell(row=row_A, column=1).value ## 遍历第2行到11行,第1列
info_id.append(id)
for col in range(2, 9): ##读取第1到9列
first = ws.cell(row=1, column=col).value
info_first.append(first) ##得到1到8列的标签
print(info_id)
print(info_first)
info_data = []
for row_num_BtoU in range(2, len(info_id) + 2): ## 遍历第2行到11行
row_empty = [] ##建立一个空数组作为临时储存地,每次换行就被清空
for i in range(2, 9): ## 遍历第2行到11行,第2到9列
data_excel = ws.cell(row=row_num_BtoU, column=i).value
if data_excel == None:
pass
else:
row_empty.append(data_excel) ##将单元格信息储存进去
info_data.append(row_empty)
print(info_data)
print(len(info_data))
# 设置雷达各个顶点的名称
labels = np.array(info_first)
# 数据个数
data_len = len(info_first)
# 新建一个excel保存结果
workbook = xlsxwriter.Workbook('C:/Users/ASUS/Desktop/result.xlsx')
worksheet = workbook.add_worksheet() # 创建一个工作表对象
# 字体格式
font = workbook.add_format(
{'border': 1, 'align': 'center', 'font_size': 11, 'font_name': '微软雅黑'}) ##字体居中,11号,微软雅黑,给一般的信息用的
# 写下第一行第一列的标签
worksheet.write(0, 0, '学生', font)
##设置图片的那一列宽度
worksheet.set_column(0, len(info_first) + 1, 11) # 设定第len(info_first) + 1列的宽度为11
##写入标签
for k in range(0, 7):
worksheet.write(0, k + 1, info_first[k], font)
# 写入最后一列标签
worksheet.write(0, len(info_first) + 1, '雷达图', font)
# 将其他参数写入excel中
for j in range(0, len(info_id)):
worksheet.write(j + 1, 0, info_id[j], font) # 写入学生号
worksheet.set_row(j, 76) ##设置行宽
for x in range(0, len(info_first)):
worksheet.write(j + 1, x + 1, info_data[j][x], font) # 写入成绩的其他参数
for i in range(0, len(info_id)):
data = np.array(info_data[i])
angles = np.linspace(0, 2 * np.pi, data_len, endpoint=False)
data = np.concatenate((data, [data[0]])) # 闭合
angles = np.concatenate((angles, [angles[0]])) # 闭合
fig = plt.figure()
ax = fig.add_subplot(111, polar=True) # polar参数!!
ax.plot(angles, data, 'bo-', linewidth=2) # 画线
ax.fill(angles, data, facecolor='r', alpha=0.25) # 填充
ax.set_thetagrids(angles * 180 / np.pi, labels, fontproperties="SimHei")
ax.set_title("学生:" + str(info_id[i]), va='bottom', fontproperties="SimHei")
ax.set_rlim(0, 100) # 设置雷达图的范围
ax.grid(True)
plt.savefig("C:/Users/ASUS/Desktop/result/学生:" + str(info_id[i]) + ".png", dpi=120)
#在python中显示
#plt.show()
##更改图片大小
infile = "C:/Users/ASUS/Desktop/result/学生:" + str(info_id[i]) + ".png"
outfile = "C:/Users/ASUS/Desktop/result1/学生:" + str(info_id[i]) + ".png"
im = Image.open(infile)
(x, y) = im.size
x_s = 80 ## 设置长
y_s = 100 ## 设置宽
out = im.resize((x_s, y_s), Image.ANTIALIAS)
out.save(outfile, 'png', quality=95)
worksheet.insert_image(i + 1, len(info_first) + 1, 'C:/Users/ASUS/Desktop/result1/' + "学生:" + str(info_id[i]) + '.png') ##写入图片
time.sleep(1) ##防止写入太快电脑死机
plt.close() # 一定要关掉图片,不然python打开图片20个后会崩溃
clock()
workbook.close() # 最后关闭excel
print('运行时间 %ss'%clock())
运行截图:生成了另外一张result的表