今天我们来分享一下新的10X单细胞通讯分析的方法,名字是ICELLNET,文章在Dissection of intercellular communication using the transcriptome-based framework ICELLNET,2021年2月份发表于NC,影响因子12分,我们先分享文章,最后来看参考代码。
abstract
这部分首先介绍了细胞通讯存在的挑战
1、global integration of cell-to-cell communication
2、biological interpretation
3、application to individual cell population transcriptomic profiles、
这几部分是细胞通讯问题的共识,当然,总是会有解决办法的。
其次介绍了软件ICELLNET的优势
1、an original expert-curated database of ligand–receptor interactions accounting for multiple subunits expression(配受体数据库,多亚基的情况,跟cellphoneDB相似)。
2、quantification of communication scores(通讯强度,这个大部分软件都会有)
3、the possibility to connect a cell population of interest with 31 reference human cell types;(这一点不是很理解,我们往下看看)。
4、three visualization modes to facilitate biological interpretation.(可视化)
最后自夸一下ICELLNET is a global, versatile, biologically validated, and easy-to-use framework to dissect cell communication from individual or multiple cell-based transcriptomic profiles(熟悉的味道,)
introduction
我们来看一下这部分的重点
Most studies in the past decades have focused on a limited number of communication molecules in a given anatomical site or physiological process.The availability of large-scale transcriptomic datasets from several cell types, tissue locations, and cell activation states, opened the possibility of reconstructing cell-to-cell interactions based on the expression of specific ligand–receptor pairs on sender and target cells, respectively.(这也是目前我们通常的做法)。Many of them exploit single-cell RNA-seq datasets to infer communication between groups of cells within the same dataset(这一点已经改进了,配受体数据库已经扩充了很多)。Despite leading to interesting and often innovative hypotheses,these methods do not integrate putative signals that may come from more distant cells.(这个地方介绍细胞通讯跟距离有关,当然有关系,分泌型的配体有半衰期,但作者怎么分析,我们往下看看)。Also, they cannot be applied to bulk transcriptomic data derived from a given cell population(这个当然是)。Such datasets are numerous in public databases, and can be a source of novel insights into how each cell type may send or receive communication signals.
Another important aspect when inferring cell-to-cell communication is the use of databases of ligand–receptor interactions(配受体库的选择). Some are very broad with over 2000 ligand–receptor pairs(例如NATMI),but lack systematic manual or expert curation(这个有的数据库很多配受体都没有验证过)。which may impact the quality and biological relevance of the annotation.Others include lower numbers of ligand–receptor pairs and provide manually curated information from the literature,without necessarily providing systematic combinatorial rules for the association of protein subunits into multimeric ligands or receptors(复合物的考虑,这个当然首推celltalker)。
The last point relates to the granularity that is structuring the biological information into families and subfamilies of functionally and structurally related molecules.(配受体的家族划分确实很多软件是不做的,我们只得到了配受体对,却没有大类划分) 。
In this study we develop ICELLNET, a versatile computational framework to infer cell-to-cell communication from a wide range of bulk and single-cell transcriptomic datasets. Each family of communication molecules is expert curated and organized into biologically relevant sub-families.(这个软件的优势,看来还是有进步的)。ICELLNET offers an array of visualization tools in order to facilitate biological interpretation and discoveries.(没有可视化的软件都是耍流氓)。
Result
第一部分Expert-curated database of ligand–receptor interactions
第一部分首先介绍数据库
数据库整合了literature and public databases(可以理解为数据库的扩充)。
数据库的特点:
1、robustness of the findings(稳定性)
2、consistency with international classifications and nomenclature(分类)
3、experimental validation of the functionality of the ligand–receptor interaction。(实验验证)。
4、We also used consensus reviews from leaders in the field(权威认证)
5、We did not include putative interactions based on protein–protein interaction predictions, as it is done in some other databases(推定的配受体要排除)
这几部分倒是很全面。
This led to the integration of 380 ligand–receptor interactions into the ICELLNET database(这个数据库是真的少)。Whenever relevant, we took into account the
multiple subunits of the ligands and the receptors。
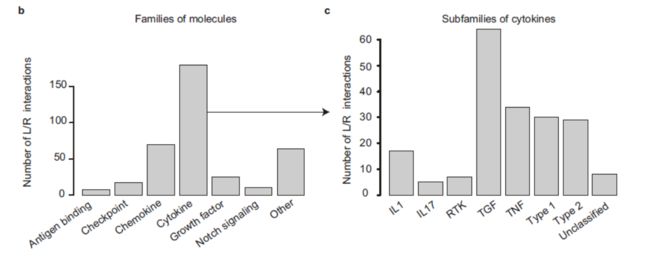
Interactions were classified into 6 major families of communication molecules, with a strong emphasis on inflammatory and immune processes: Growth factors, Cytokines, Chemokines, Immune Checkpoints, Notch signaling, and Antigen binding(分类倒是很不错)。
Cytokine–receptor pairs were mapped in an exhaustive manner, by exploiting a series of reference articles and consensus classifications. They represent 50% of the total interactions included in the database (194 interactions), and were further classified into 7 sub-families according to structural protein motifs: type 1 cytokines, type 2 cytokines, IL-1 family, IL-17 family, TNF family, TGF-ß family, and RTK cytokines(对细胞因子进行了详细的划分)。
This database is integrating information on both multiple subunits of ligands and receptors, and a classification into molecular families/subfamilies.(数据库的优势还是很明显的,就是有点少)。
第二部分结果Development of a computational pipeline to dissect intercellular
communication.(新的算法)
In the ICELLNET framework, we developed an automatized tool in R script to infer communication between multiple cell types by integrating“
(1)prior knowledge on ligand–receptor interactions
(2)computation of a communication score between pairs of cells based on their
transcriptomic profiles(这个很大众)
(3)several visualization modes to guide results interpretation.(可视化,也很大众)
Quantification of intercellular communication was achieved by scoring the intensity of each ligand–receptor interaction between two cell types from their expression profiles
这里我们需要重点注意配受体分数的算法,我们方法中分析。还有就是自己的样本会与数据库的基础分析结果进行比较。
From each transcriptomic profile, all genes or only differentially expressed genes could be used,(这个地方要注意,最好还是差异基因)and no filtering threshold
was applied to gene expression.the genes coding for ligands/receptors were
selected from all 380 interactions to compute the score, but it is also possible to restrict the database to specific families of molecules, depending on the biological question.(大众的做法)。
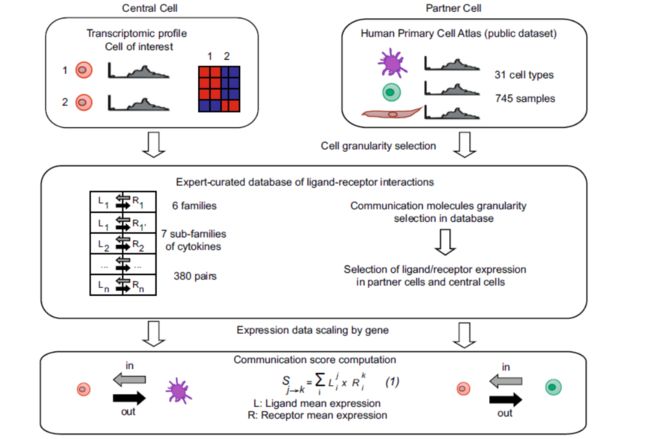
A unique feature and strength of ICELLNET is its ability to infer cell-to-cell communication even from an individual cell population-based transcriptome of interest(这不算优势了,很多软件可以做了)。ICELLNET separately considers other cell types with known transcriptomic profiles (hereafter called « partner cells ») that can connect to the central cell. These can be cell types coming from the same dataset as the central cell, or from any other transcriptomic dataset.(这个地方值得注意,对其他转录组数据和自己的目标细胞配受体推断,其中提到了Human Primary Cell Atlas)。This public dataset includes transcriptomic profiles of 31 human cell types including immune cells, stromal cells, neural cells, and tissuespecific cell types, all generated with the same Affymetrix technology(这就是abstract里面疑问的解答)。
第三部分结果Establishment of a score to assess the communication between
cells.
Since cell-to-cell communication is directional, we considered ligand expression from the central cell, and receptor expression from the partner cells in order to assess outward communication. Conversely, we then selected receptor expression from the central cell, and ligand expression from partner cells in order to assess inward communication。(很简单),接下来看一个炸弹,For each gene, expression levels were scaled by maximum of gene expression in the dataset, in order to avoid a communication score predominantly driven by highly expressed genes. Indeed, bioactivity of communication molecules varies a lot. Some cytokines, such as IL-12 and IL-4, are very bioactive at low concentrations, and often expressed at very low levels both in transcript and protein. Conversely, many chemokines are produced at much higher levels, without necessarily having a higher bioactivity. Not scaling the data before inferring a communication score would systematically favor a few highly expressed molecules, and would not allow detecting the contribution of important molecules expressed at much lower levels.(这个地方值得深思,我相信大家做细胞通讯都是使用均一化的数据,使用scale的数据非常少见,但作者给出的理由也很充分)。
分析结果第四部分ICELLNET offers different graphical representations allowing multiple layers of interpretation.(可视化)
至于结果的后面都是一些应用案例了,不用看都知道效果不错,不然肯定发不出来。
Method,我们关注重点
Gene expression matrix scaling method. After selecting the genes corresponding to the ligands and/or receptors from the transcriptional profiles, each ligand/receptor gene expression is scaled by maximum of gene expression among all the conditions and then multiplied by 10, to have values ranging from 0 to 10(这个地方要不要借鉴值得一试). For each gene, the maximum value (10) is defined as the mean of expression of the 5% highest values of expression for RNA-seq and microarray datasets. Outliers are rescaled at 10 if above maximum value.
接下来是难点,score的计算Intercellular communication score computation.
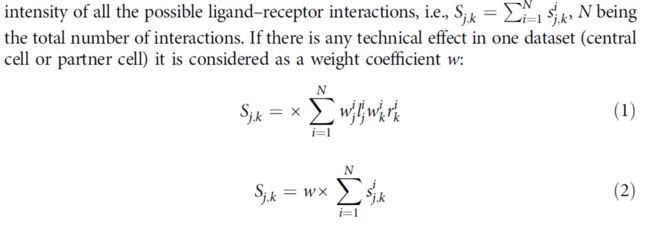
To score the intensity of a particular ligand–receptor interaction between a central cell and a given partner cell, we considered the product of the expression of the ligand in the central cell and of the cognate receptor in the partner cells.Formally, if lij is the average expression level of ligand i by the central cell in the experimental condition j, and rik
is the average expression of the corresponding receptor by cell type k, the intensity sij,k of the corresponding interaction was quantified by sij,k = rik * lij (还是平均值相乘)。For interactions requiring
multiple components of the ligand and/or of the receptor, we considered a geometric
average of the receptor components.(对于复合物的计算采用复合物表达的平均值,这个相对于cellphoneDB的方法有差异)。To assign a global score Sj,k to the communication between the central cell in the condition j and cell type k, a composite score was defined by summing up the intensity of all the possible ligand–receptor interactions,
当然还有一些其他注意的地方,这里我们就不多说了。
最后,我们来看看实例代码
首先加载模块
library(BiocGenerics)
library("org.Hs.eg.db")
library("hgu133plus2.db")
library(jetset)
library(ggplot2)
library(dplyr)
library(icellnet)
library(gridExtra)
library(Seurat)
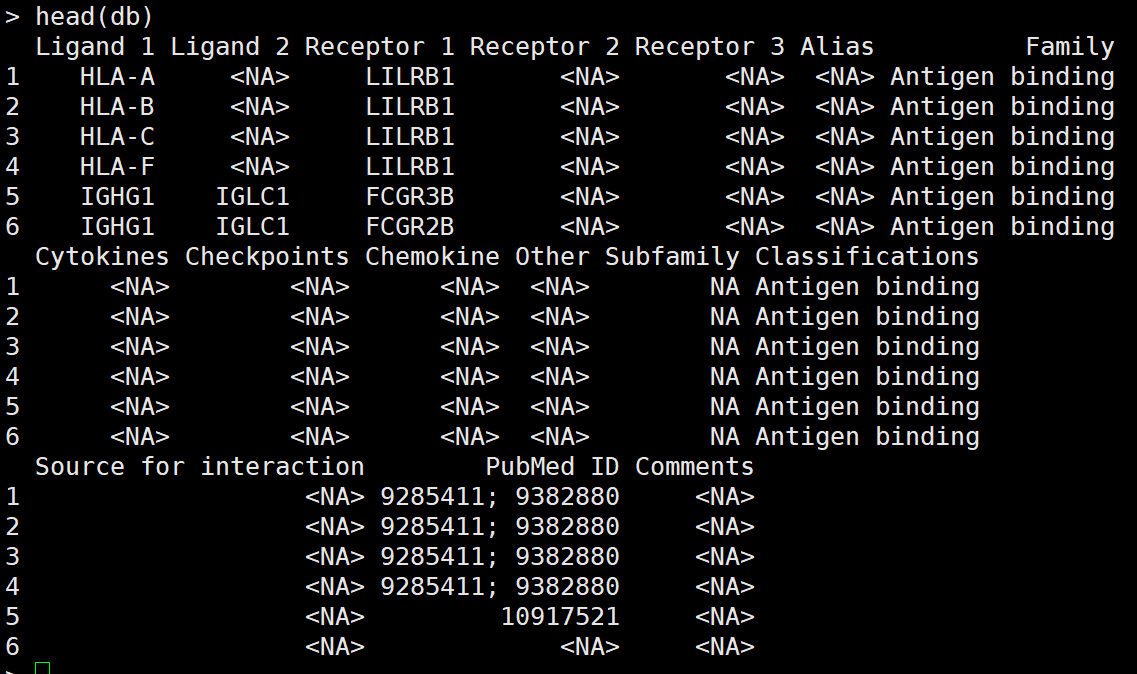
先来看一看配受体库
db=as.data.frame(read.csv(curl::curl(url="https://raw.githubusercontent.com/soumelis-lab/ICELLNET/master/data/ICELLNETdb.tsv"), sep="\t",header = T, check.names=FALSE, stringsAsFactors = FALSE, na.strings = ""))
确实进行了详细的划分,值得学习。
1 - Load Seurat object
#Load data
seurat <- readRDS(file = "Lupus_Seurat_SingleCell_Landscape.Rds")
seurat <- NormalizeData(seurat)
seurat <- ScaleData(seurat)

#only for UMAP visualization, not for ICELLNET purpose
seurat <- FindVariableFeatures(seurat, selection.method = "vst", nfeatures = 2000)
seurat <- RunPCA(seurat)
seurat <- RunUMAP(seurat, dims = 1:50)
DimPlot(seurat, reduction = 'umap', group.by = 'author_annotation', label = T)
如果我们之前做过Seurat分析了,这一步不需要再进行这么多的处理了。
2 - Retrieve gene expression matrix
a - Compute manually average gene expression per cluster without filtering
# Taking into account the total nb of cells in each cluster
filter.perc=0
average.clean= sc.data.cleaning(object = seurat, db = db, filter.perc = filter.perc, save_file = T, path="path/", force.file = F)
b - Compute manually average gene expression per cluster with filtering for gene expression by a defined cell percentage at a cluster level
ICELLNET offers the possibility to filter the initial gene expression matrix to keep genes at least expressed by defined percentage of cell in their respective cluster (below 2%):
filter.perc=2
average.clean= sc.data.cleaning(object = seurat, db = db2, filter.perc = filter.perc, save_file = T, path="path/", force.file = F)
This filtering allows to remove all the genes that are expressed by a very low number of cells in some clusters, to avoid false negative cell-cell interactions scores. If you are applying ICELLNET for the first time on your dataset, we advice to apply first ICELLNET without filtering, and then with filtering at 2% to see the differences and filtered genes. This will help a lot in the analysis and for biological interpretation of the data(挑选配受体)。
3 - Apply icellnet pipeline on cluster of interest
In this example, we investigate cDC to T cell communication from CM3 cluster (= conventional dendritic cells, 82 cells), to either CT3b or CT0a clusters (CT3b=TFH-like cells, 50 cells ; CT0a = effector memory CD4+ T cells, 220 cells).
Format CC.data and PC.data and PC.target
data.icell=as.data.frame(gene.scaling(as.data.frame(average.clean), n=1, db=db))

PC.data=as.data.frame(data.icell[,c("CT3b","CT0a", "Symbol")], row.names = rownames(data.icell))

PC.target=data.frame("Class"=c("CT3b","CT0a"), "ID"= c("CT3b","CT0a"), "Cell_type"=c("CT3b","CT0a"))
rownames(PC.target)=c("CT3b","CT0a")

my.selection=c("CT3b","CT0a")
Compute intercellular communication scores
We investigate conventional dendritic cells (cDCs, CM3 cluster) to T cell (either CT3b or CT0a clusters) outward communication, so this means that we consider ligands expressed by cDCs and receptors expressed by T cells to compute intercellular communication scores. Outward communication -> direction = "out"
score.computation.1= icellnet.score(direction="out", PC.data=PC.data,
                                    CC.data= as.data.frame(data.icell[,c("CM3")], row.names = rownames(data.icell)),
                                    PC.target = PC.target, PC=my.selection, CC.type = "RNAseq",
                                    PC.type = "RNAseq",  db = db)
score1=as.data.frame(score.computation.1[[1]])
lr1=score.computation.1[[2]]
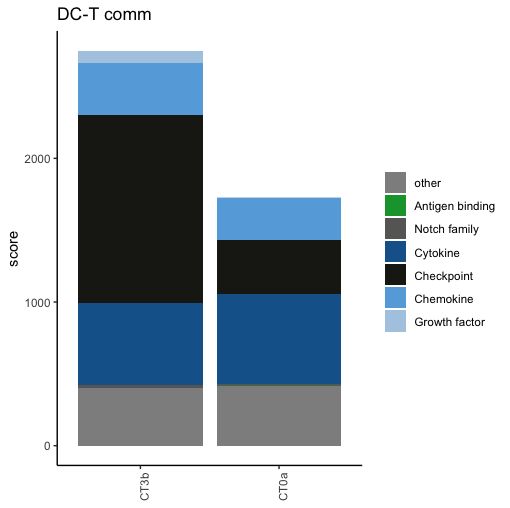
Visualisation of contribution of family of molecules to communication scores
# label and color label if you are working families of molecules already present in the database
my.family=c("Growth factor","Chemokine","Checkpoint","Cytokine","Notch family","Antigen binding")
family.col = c( "Growth factor"= "#AECBE3", "Chemokine"= "#66ABDF", "Checkpoint"= "#1D1D18"  ,
            "Cytokine"="#156399", "Notch family" ="#676766", "Antigen binding" = "#12A039",  "other" = "#908F90",  "NA"="#908F90")

ymax=round(max(score1))+1 #to define the y axis range of the barplot

LR.family.score(lr=lr1, my.family=my.family, db.couple=db.name.couple, plot=F) # table of contribution of each family of molecule to the scores

LR.family.score(lr=lr1, my.family=my.family, db.couple=db.name.couple, plot=T, title="DC-T comm", family.col=family.col) #display barplot
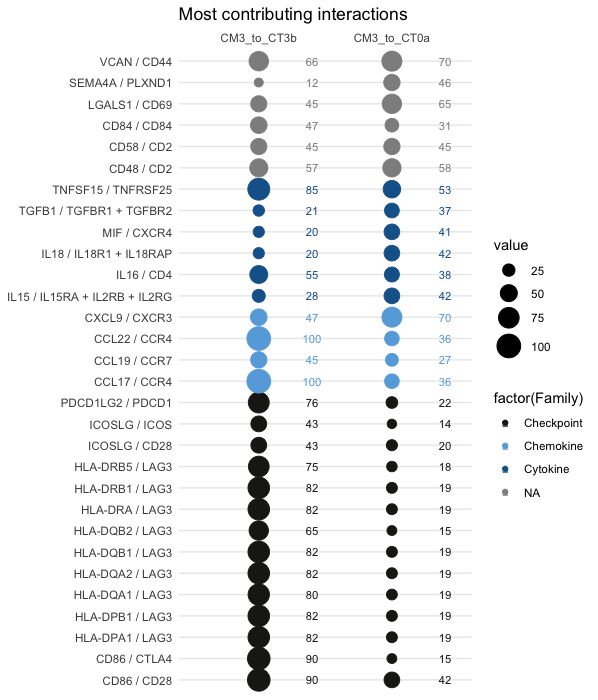
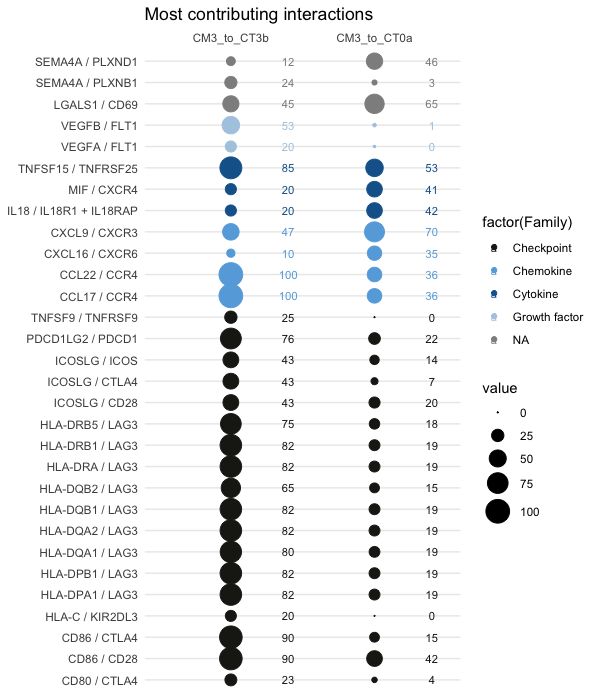
Visualisation of highest and most different interactions between the two conditions (selection of topn=30 interactions):
30 first most contributing interactions (sort.by="sum")
colnames(lr1)=c("CM3_to_CT3b", "CM3_to_CT0a")
LR.balloon.plot(lr = lr1, thresh = 0 , topn=30 , sort.by="sum",  db.name.couple=db.name.couple, family.col=family.col, title="Most contributing interactions")
30 first most different interactions between the conditions (sort.by="var")
colnames(lr1)=c("CM3_to_CT3b", "CM3_to_CT0a")
LR.balloon.plot(lr = lr1, thresh = 0 , topn=30 , sort.by="var",  db.name.couple=db.name.couple, family.col=family.col, title="Most contributing interactions")
Remarks on biological interpretation:
ICELLNET will always set, for each gene, maximum gene expression value at 10. Then, the maximum score that you can obtain for an individual interaction is 100 (10 for the ligand, 10 for the receptor).(注意分析得到的配受体强度)
This means that high interaction scores does not mean high expression. You should come back to the initial SeuratObject to look at individual gene expression, and that the ligand/receptor of interest if effectively expressed by the cluster.(得到的结果需要手动检验)
Filtering of genes expressed by each cluster according to cell percentage expressing the gene (= with counts >0) for each cluster can be an option to remove false-negative interactions scores. This can be done with the sc.data.clean function, by setting filter.perc to a defined value (2 for 2%, 5 for 5% etc...). Filtered genes (expressed by a number of cells among the cluster below the percentage) will be set to 0.(挑选基因)
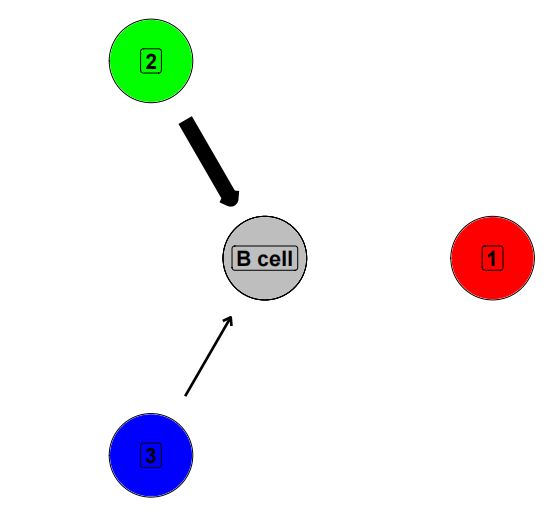
最后圈图的画法
network.create(score1,PC.col = color)
最后呢,问各位道友一句做细胞通讯是不是要对输入的矩阵做Scale呢?,不知道大家自己的答案是怎么样的
生活很好,有你更好

