Lumerical官方案例、FDTD时域有限差分法仿真学习(一)——闪耀光栅(Blazed grating)
这个例子(链接)展示了如何计算闪耀光栅的光栅阶数。 该光栅在每个波长有许多光栅阶。 为了捕捉全反射和透射的特征,监视器中需要更多的频率点。
一、模拟设置
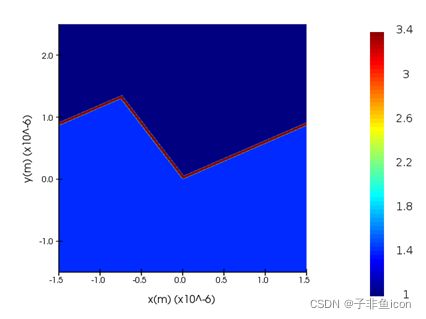
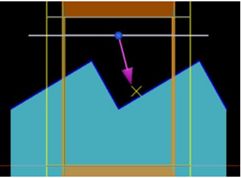
上面的模拟文件中显示了闪耀光栅。 它由低折射率 (1.4) 基板和 40nm 厚的高折射率 (3.4) 涂层组成。 光栅角度为30度。 宽带平面波源以 15 度角入射。 我们将使用光栅阶透射部分中描述的光栅阶透射分析对象来测量反射和透射。
1.1 该例子中光栅周期为3um,基底厚度也为3um,闪耀角为30度,5个周期。
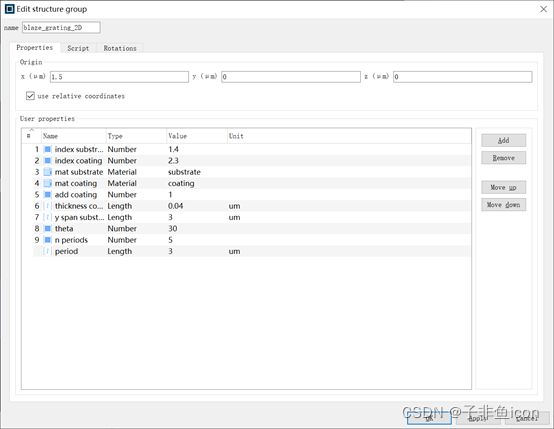
(注:按文中所述,这里设置index coating应该设置为3.4啊,但我打开下载的案例文件显示的是2.3.但是我打开折射率监视器,涂层的折射率的确为3.4。我把它修改为3.4也没什么变化,此处存疑)
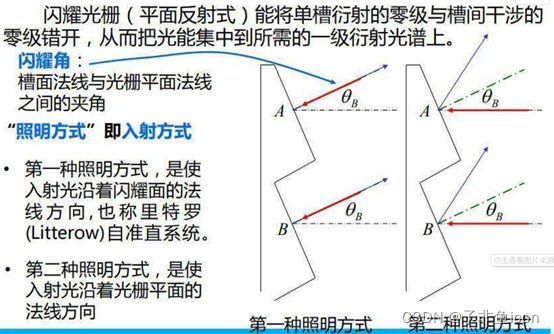
1.2 由于该例子中使用,宽带平面波源以 15 度角入射,应使用BFAST.
•对于宽带模拟,应该使用BFAST源类型和边界,BFAST(Broadband fixed angle source technique),宽带固定角度光源技术的简称,它允许在宽带波长范围内以恒定的角度注入光。当使用BFAST源时,BFAST边界条件将自动用于模拟区域的边界。
•Bloch边界条件类似于周期边界,但他们考虑了在给定的光源注入角度下,器件各周期之间的相位差。Bloch边界使每个单元之间的相位差不受波长的影响。因此,如果要在一个宽频带范围内注入光,注入的角度将随波长的变化而变化,以满足Bloch边界的相位约束条件。
•Angle theta 和angle phi可用于旋转源传播方向,其中theta是传播方向与入射平面的法线的夹角,phi是传播方向绕着入射平面的法线右转的角度。(两个角度才能确定一个方向)
•极化角度polarization angle:确定了电场极化的方向,电场与传播方向形成的平面与入射面的法线所形成的角度(P极化:0度,S极化:90度)(蓝色箭头)。
当theta角度为0时,phi角度与极化角度其实是一样的。

(注:由入射光线与入射点处的法线所构成的平面,称为入射面)
1.3 查看其仿真区域设置
•一旦在源中选择了"BFAST",就会根据BFAST的公式自动覆盖与波传播横向的边界条件。例如,如果用户在横向方向上选择"Bloch",“周期”,“金属"或"PML”,将显示警告标志。下图显示了为沿z方向注入的平面波源选择BFAST的情况。在这种情况下,x 和 y 方向上的 BC 应由 BFAST 技术覆盖,由右侧的警告标志显示。但是,可以保留对称 BC(如果源以 xz 平面中的某个角度注入,但在 yz 平面中没有角度,则 yz 平面仍可以使用适合源极化的对称 BC)。因此,在这种情况下,只有 x 方向上的 BC 才会被 BFAST 覆盖。PML 像往常一样在 z 方向上使用。

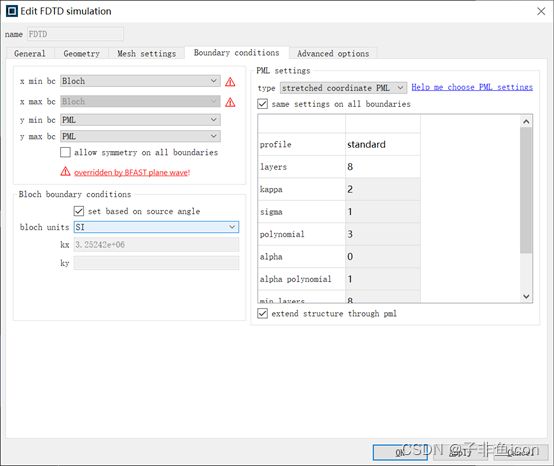
为了总结BFAST的用法,这些过程是:
在"源常规"选项卡中将"平面波类型"设置为"BFAST";
将沿纵向的边界条件设置为 PML。GUI将自动在横向使用BFAST的内置边界条件。为了保持一致性,用户可以在角度入射平面中设置"Bloch"(尽管它被覆盖),并在没有角度平面的情况下设置对称BC(如果适用)。
•该例子中的mesh accuracy设置为4;
(网格大小是按照器件内最短波长的几分之一设置的,Mesh accuracy 2M对应1/10,3对应1/14,4对应1/18等。)
二、结果
打开 grating_blaze.fsp 并运行模拟。 完成后,使用脚本 grating_blaze.lsf 计算来自光栅的固定波长的反射和光栅阶数。 请注意,我们使用了 BFAST,因此宽带源以相同的入射角注入所有波长。
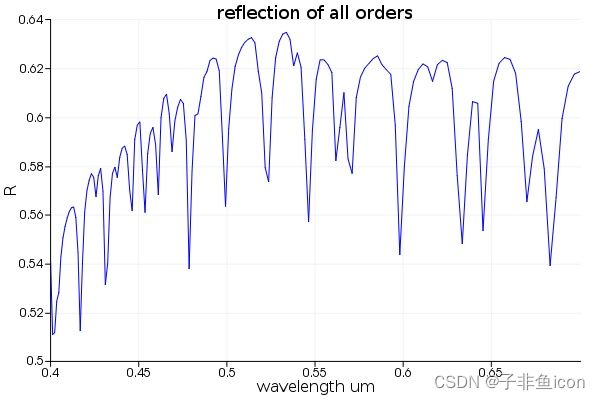
2.2 第二个图显示了所有衍射级的反射作为 0.4um 到 0.7um 波长的函数。 从下图可以看出,在每个波长,都有很多衍射级。 为了获得平滑的反射曲线,需要比平时更多的频率点。 在本例中,使用了 150 个频点。 但是,可以看出,需要更多的频率点(例如 200 个)才能获得更平滑的结果。
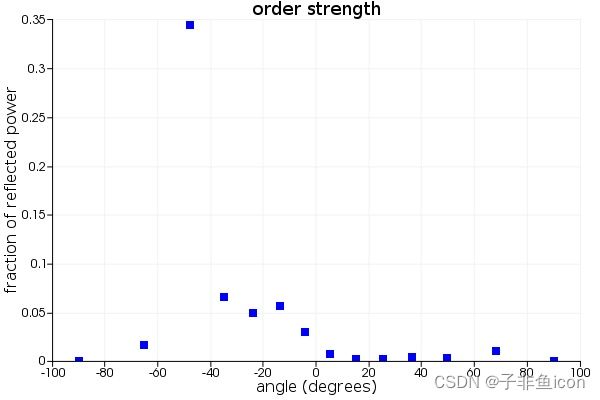
2.3 第三幅图显示了对于给定波长 0.5um 的反射与角度的函数关系。 如果您想在任何其他波长获得此结果,只需简单地修改脚本中的“target_wavelength”即可。
三、Script学习
3.1 grating_R的setup
Variables分析
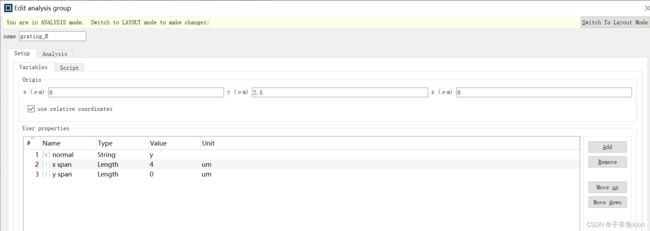
变量(Variables)的属性里添加了三个参数,normal(类型是String,字符串类型), x span, y span(类型都是Length)
从程序来看,normal用以设置法线方向,x span和y span用以设置监视器的宽度
Script分析
deleteall;
# 删除当前组群范围内的所有实体对象,实体对象包括 物理结构、光源、监视器、以及模拟体积本身
##############################################
# Grating transmission
# This script sets up the monitor to calculate the Grating Transmission.
#此脚本设置监视器以计算光栅透射率
# This monitor must be 1D.  The span specified in the normal direction will be ignored
# 这个监视器必须是一维的,法线方向指定的跨度将被忽略
#
# Input parameters
# x,y span: length of monitor
# normal: the surface normal, either 'x', 'y'
#
# Tags: far field grating order transmission
# 远场光栅阶次传输
#
# Copyright 2012 Lumerical Solutions Inc
##############################################

# simplify variable names by removing spaces
# 通过删除空格来简化变量名
x_span = %x span%; # 有空格的变量会在变量名称前后放置一个百分号,这里相当于给他另外取了一个名字
y_span = %y span%;

if ((normal != "x") and (normal != "y")) {
  message("Surface normal '" + normal + "' is invalid.  Must be 'x', 'y'.  Using y normal.");
  normal ="y";  # if normal is not specified properly, default to y normal
}
# message用于创建显示一些文本的消息窗口,要继续进行,需点击Enter或OK
# 用法:message("text").相当于提示你,输入的normal必须是x或者y,其他的都不对。
# 如果未能正确指定,默认使用y normal
if (normal=="x") { x_span = 0; }  # set span in normal direction to zero
if (normal=="y") { y_span = 0; }

addpower;
# 向模拟环境中添加一个功率监视器,可用于FDTD和MODE
set("name","transmission_grating");
set("monitor type","2D z-normal");

set("x",0);# 设置x中心点坐标
set("y",0);# 设置y中心点坐标

set("x span",x_span); # #设置x方向宽度
set("y span",y_span);

当在normal那里输入yy时,再点击script下方的test,提示如下:

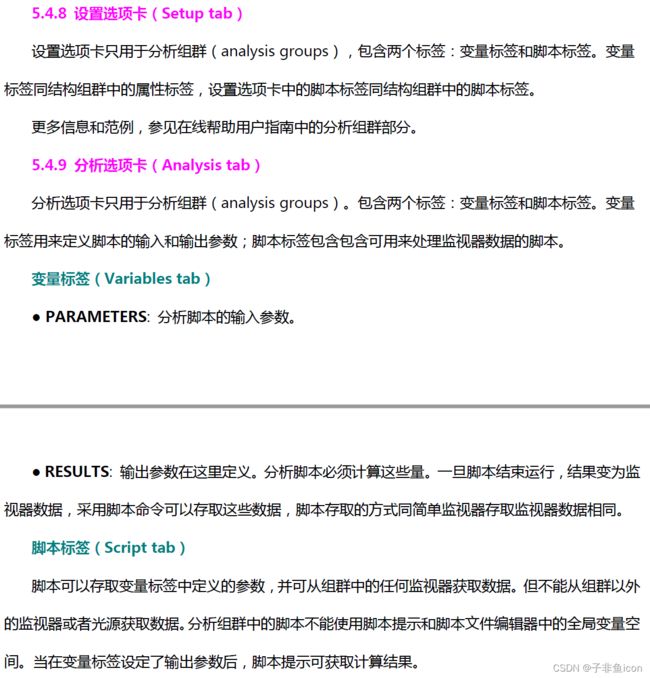
3.2 grating_R的Analysis
Variables分析
这里的属性参数主要有:
make plots:1画图,0其他
n target:要绘制的光栅级数,0表示0级
lambda target:要绘制的波长
Results包括 :
f:频率向量
n:光栅级数向量
T(f):总传输功率vs频率
T_grating(f):传输到每个光栅阶的功率
num_orders(f):传播光栅级数的数量
theta(n,f):光栅阶角

Script分析
大多数数据以多维的形式记彔的。例如,在 FDTD 和 MODE Solutions 中的监视器通常返回的数据是4D矩阵。矩阵中开始的3维为空间维X, Y, Z。 根据监视器类型的不同,第4维是频率或者时间维度。例如,假设你有一个 FDTD Solutions 模拟,用频率监视器在XY平面记彔了20个频率点。假设监视器在 x 方向的跨距是100个网格点, y 方向的跨距是55个网格点,Ex 场分量数据矩阵的大小将是 100ⅹ55ⅹ1ⅹ20。注意第3维(相对于Z)的大小为1,因为监视器仅在一个Z位置记彔数据。
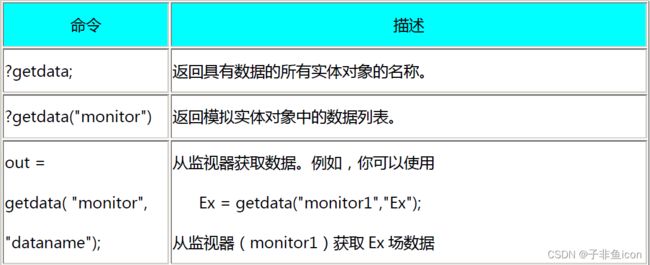
3.2.1 getdata

3.2.2 transmission

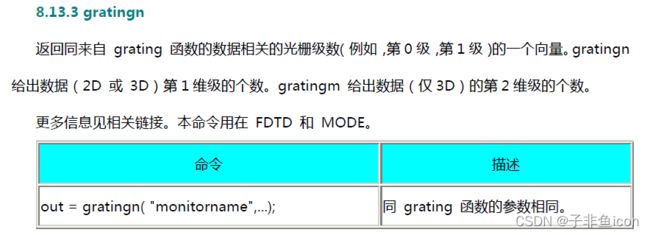
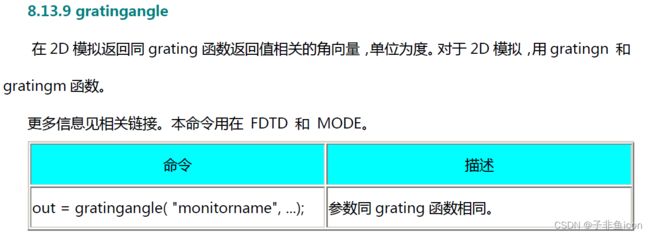
3.2.3 gratingn


这里的频率点f是频率点的个数。
3.2.4 matrix

3.2.5 find
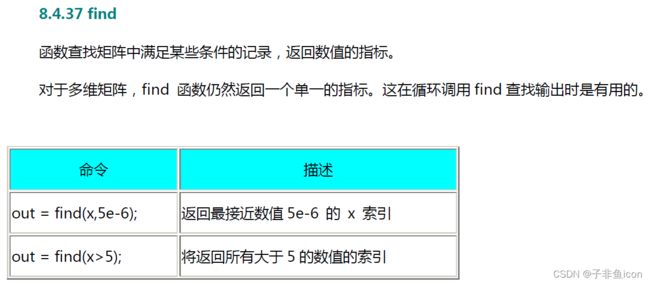
3.2.6 find the maximum possible number of grating orders, this occurs at the maximum frequency
#找到最大可能的光栅阶数,这发生在最大频率
自己的解释:由光栅方程,d(sini ± sinθ)=mλ m=0,±1,±2,…
m要想最大,波长λ 就要小,频率就要大。
(这里恳请批评指正!!!)
3.2.7 sum

3.2.8 pinch

例:E2=getelectric(T),这是E2应该是矢量,(EX2,EY2,EZ2,f),于是pinch(E2,4,1)表示去掉第4维,但是保留指数是1的数值,也就是取f(1),即频率第一个数值。
3.2.9 plot

3.2.10 num2str

3.2.11 round

##############################################
# Grating transmission
# This object calculates the fraction of power transmitted to each
# grating order at all frequency points recorded by the monitor.
# It also calculates the number of propagating grating orders
# 此对象计算在监视器记录的所有频率点上传输到每个光栅阶的功率分数。 它还计算传播光栅阶数。
#
# Input properties
# make plots: 1 to make plots, 0 otherwise
# n target: grating order to plot
# lambda target: wavelength to plot
#
# Output properties
# f: frequency vector
# n: grating order number vector
# T(f): total transmitted power vs frequency
# T_grating(n,f): transmitted power to each grating order
# num_orders(f): number of propagating grating orders
# theta(n,f): grating order angles
#
# Tags: far field grating order transmission
# 远场光栅阶次传输
#
# Copyright 2012 Lumerical Solutions Inc
##############################################

# simplify input variable names by removing spaces
make_plots = %make plots%;
n_target = %n target%;
lambda_target = %lambda target%;

# specify monitor name
# 指定监视器名称
mname="transmission_grating";

# get frequency vector
f=getdata(mname,"f"); # 获取一个模拟实体对象的原始数据
size_f=length(f);
# 返回一个矩阵中元素的个数,n×m,参数是字符串,则返回字符串长度

# get total net power transmitted through monitor
# 获取通过监视器传输的总净功率
T=transmission(mname); # 返回通过一个监视器的功率传输

# find the maximum possible number of grating orders
# this occurs at the maximum frequency
# 找到最大可能的光栅阶数,这发生在最大频率
n=gratingn(mname,size_f); # 迒回光栅级号的一个向量,这里填入size_f表示最大频率的索引,函数返回最大频率的光栅阶数
size_n=length(n);

# initialize matrices # 初始化矩阵
T_grating = matrix(size_n,size_f); # grating order strength vs f # 光栅阶强度 vs 频率
# matrix初始化一个矩阵,所有元素设置为 0
theta     = matrix(size_n,size_f); # angle matrix


# loop over each frequency point 在每个频率点上循环
for (i=1:size_f) {

  # get the grating numbers at this frequency# 得到这个频率的光栅数
  n_tmp = gratingn(mname,i);

  # calculate indices for inserting these results into final matrix # 计算将这些结果插入最终矩阵的索引
  n1    = find(n,n_tmp(1));# n_tmp的第一个
  n2    = find(n,n_tmp(length(n_tmp)));# n_tmp的最后一个

  # calculate grating order angles
  # set unused orders to -90 or +90
  # 计算光栅阶角,将未使用的级数设置为 -90 或 +90
  theta(1:n1,i)      = -90;
  theta(n2:size_n,i) = 90;
  theta(n1:n2,i)     = gratingangle(mname,i);

  # calculate grating orders and save into T_grating matrix
  # 计算光栅阶数并保存到 T_grating 矩阵中
  T_grating(n1:n2,i)=grating(mname,i)*T(i);
  # 为了将其转换为光源的分数,乘以传输脚本函数(见grating函数定义)
}


# Calculate the number of grating orders (theta < 90)
# # 计算光栅阶数的数量(theta < 90)
num_orders = sum( (abs(theta) < 89.9)  ,1);
# 按列求和,因为一行是某一光栅阶的强度,一列是某频率点下的强度,后面为1,表示在竖的方向上求和,得到各个频率点下的光栅阶的数量(<89.9能排除未使用的级数)


if (make_plots) {

  # plot number of orders
  plot(c/f*1e9, num_orders,
       "wavelength (nm)","","Number of grating orders");

  # plot data for a particular grating order
  # 绘制特定光栅级数的数据
  T_grating_plot = pinch( T_grating,1,find(n,n_target) ); # 选取特定维绘制图像
  theta_plot     = pinch( theta    ,1,find(n,n_target) );

  plot(c/f*1e9, T, T_grating_plot,
       "wavelength (nm)","Transmission","Transmission");
  legend("Total","To order ("+num2str(n_target)+")");
  plot(c/f*1e9, theta_plot,
       "wavelength (nm)","angle (deg)","Propagation angle for order ("+num2str(n_target)+")");
# +用来拼接字符串

  # plot results at one frequency point
  fi             = find(c/f,lambda_target);
  theta_plot     = pinch(theta,2,fi);
  T_grating_plot = pinch(T_grating,2,fi);
  plot(theta_plot,T_grating_plot,
        "theta (deg)","Transmission","Transmission at "+num2str(round(c/f(fi)*1e9))+"nm","plot points");
}
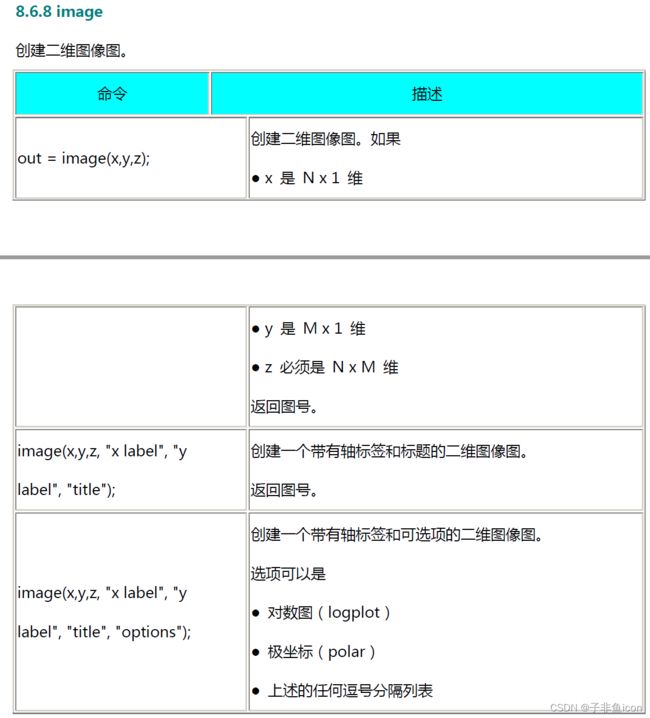
3.3.1 image
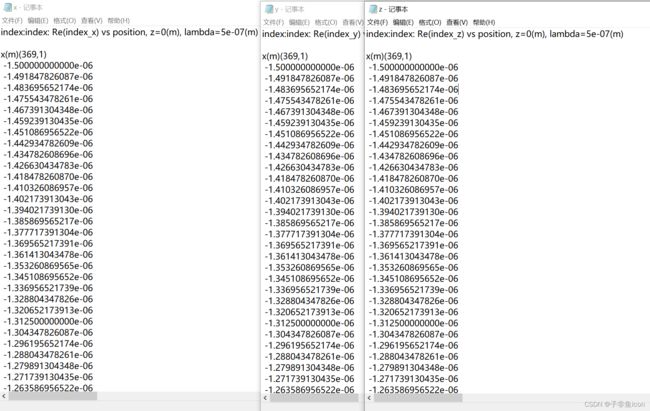
3.3.2 解释getdata(“index”,“index_z”)
这里应该是都是各向同性的材料,所以index_x, y, z数据都相同(见下图)
3.3.3 select

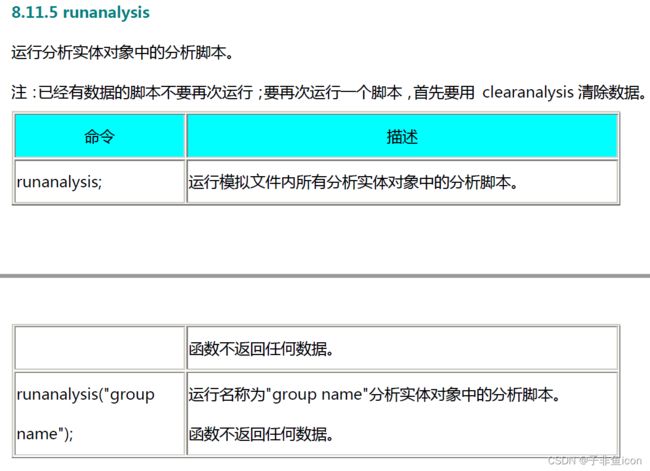
3.3.4 runanalysis
3.3.5 ?
应用脚本中含有将结果输出到屏幕的命令,例如,"?",计算得到的输出结果便打印到窗口的分析脚本输出部分
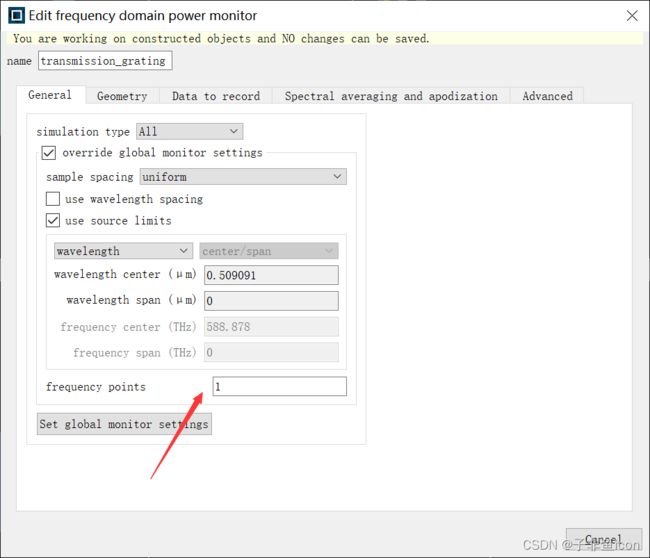
3.3.6 设置频率点
选择“覆盖全局监视器设置”(override global monitor settings),可以设置频率点个数。在大多数情况下,使用全局监视器设置是非常方便的,覆盖他们并不常见。若覆盖此处的设置,则是希望不同的监视器记录不同数量的频率点。
(本来试着修改频率点为10的,但这里提示无法修改,此处存疑)
###############################################
# script file: blaze_grating.lsf
#
# Calculates and plots the strengths of
# each order for a grating
#
# Copyright 2010 Lumerical Solutions
###############################################

# image the index profile
image(getdata("index","x")*1e6,
      getdata("index","y")*1e6,
      getdata("index","index_z"),
      "x (um)", "y (um)","Index profile");
# image创建二维图,plot是创建线图
#monitors;
select("grating_R");
select("grating_T");
set("make plots",0);
runanalysis;

m="grating_R";
theta=getdata(m,"theta");
R_grating=getdata(m,"T_grating");
R=getdata(m,"T");


plot(theta,R_grating,
    "angle (degrees)",
    "fraction of reflected power", # 反射功率分数
    "order strength",
    "plot points");

?"Total reflection: " +num2str(R); # 打印输出结果
?"Reflection to each order: [theta(i), R(i)]";
?num2str([theta, R_grating]);
