2021电赛F题之openmv巡线(完结)
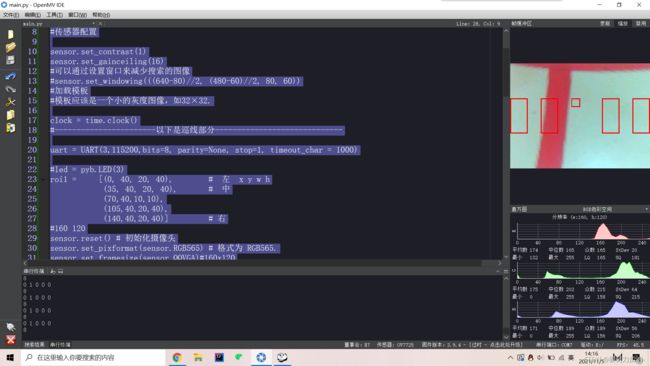
效果展示:
出错解决方法

通过使用不同阈值的方法可以得到当前区域中什么区域有红线,对于电控而言作用类似于红外对管,之后电控通过逻辑判断如何运动,这就是我们队伍目前的思想。最后会不会用上还不确定。
如果对你有帮助就点个赞吧
import pyb, sensor, image, math, time
from pyb import UART
import ustruct
from image import SEARCH_EX, SEARCH_DS
#传感器配置

sensor.set_contrast(1)
sensor.set_gainceiling(16)
#可以通过设置窗口来减少搜索的图像
#sensor.set_windowing(((640-80)//2, (480-60)//2, 80, 60))
#加载模板
#模板应该是一个小的灰度图像,如32×32.

clock = time.clock()
#-----------------------以下是巡线部分-----------------------------

uart = UART(3,115200,bits=8, parity=None, stop=1, timeout_char = 1000)

#led = pyb.LED(3)
roi1 =     [(0, 40, 20, 40),        #  左  x y w h
            (35, 40, 20, 40),       #  中
            (70,40,10,10),
            (105,40,20,40),
            (140,40,20,40)]         # 右
#160 120
sensor.reset() # 初始化摄像头
sensor.set_pixformat(sensor.RGB565) # 格式为 RGB565.
sensor.set_framesize(sensor.QQVGA)#160x120
sensor.skip_frames(time=2000) # 跳过10帧,使新设置生效
sensor.set_auto_whitebal(True) # turn this off.
sensor.set_auto_gain(False) # must be turned off for color tracking
sensor.set_vflip(False)# 垂直方向翻转
sensor.set_hmirror(False)# 水平方向翻转
clock = time.clock()

#low_threshold = (0, 100)  # 105--115
#GRAYSCALE_THRESHOLD = [(20,100)]
#思路 现在需要除红线外全是黑色,红线为白
GROUND_THRESHOLD=(59, 25, 127, 19, -128, 89)
def sending_data(data):
    global uart;
    data = ustruct.pack(",      #格式为俩个字符俩个短整型(2字节)
                   0xA5,                      #帧头1
                   0xA6,
                   data
                   )        #数组大小为7,其中2,3,4,5为有效数据,0,1,6为帧头帧尾
    uart.write(data);   #必须要传入一个字节数组
    #print("head",data[0],"status",data[1],"tail",data[2])
    print(data[2])
getp=0
#GRAYSCALE_THRESHOLD =(59, 25, 127, 19, -128, 89)
GROUND_THRESHOLD1=(78, 24, 127, 18, -28, 59)
#GRAYSCALE_THRESHOLD =(100, 33, 114, 22, 11, 127)#(100, 33, 127, 28, -4, 127)#(100, 30, 127, 17, -37, 127)
while(True):
    data=0
    blob1=None
    blob2=None
    blob3=None
    blob4=None
    blob5=None
    flag = [0,0,0,0,0]
    img = sensor.snapshot().lens_corr(strength = 1.7 , zoom = 1.0)#畸变矫正
    #img.binary([low_threshold],invert = 1)#设置最低阈值 反转
    #img = sensor.snapshot().binary([GROUND_THRESHOLD])

    blob1 = img.find_blobs([GROUND_THRESHOLD1], roi=roi1[0]) #left
    blob2 = img.find_blobs([GROUND_THRESHOLD1], roi=roi1[1]) #middle
    blob3 = img.find_blobs([GROUND_THRESHOLD], roi=roi1[2])
    blob4 = img.find_blobs([GROUND_THRESHOLD1], roi=roi1[3])
    blob5 = img.find_blobs([GROUND_THRESHOLD1], roi=roi1[4])
    if blob1:
        flag[0] = 1  #左边检测到红线
    if blob2:
        flag[1] = 1  #中间检测到红线
    if blob3:
        flag[2] = 1  #右边检测到红线
    if blob4:
        flag[3] = 1  #中间检测到红线
    if blob5:
        flag[4] = 1  #右边检测到红线
    print(flag[0],flag[1],flag[2],flag[3],flag[4])
    for i in (0,1,2,3,4): # 0 1 2 3 4
        data|=(flag[i]<<(4-i))
    sending_data(data)
    for rec in roi1:
        img.draw_rectangle(rec, color=(255,0,0))#绘制出roi区域