matlab---微分方程组与相平面
求解二元微分方程组
>> syms x(t) y(t);
eqn=[diff(x,t)==y,diff(y,t)==-x];
>> s=dsolve(eqn)s =
包含以下字段的 struct:
y: [1×1 sym]
x: [1×1 sym]>> y(t)=s.y
y(t) =
C2*cos(t) - C1*sin(t)
>> x(t)=s.x
x(t) =
C1*cos(t) + C2*sin(t)
有初始条件时:
>> syms x(t) y(t);
eqn=[diff(x,t)==y,diff(y,t)==-x];
cond=[x(0)==-1;y(0)==2];
s=dsolve(eqn,cond)s =
包含以下字段的 struct:
y: [1×1 sym]
x: [1×1 sym]>> y=s.y
y =
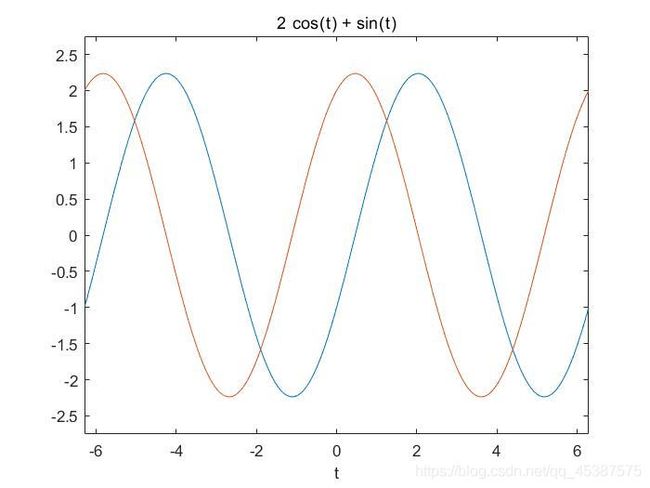
2*cos(t) + sin(t)
>> x=s.x
x =
2*sin(t) - cos(t)
>> ezplot(s.x)
hold on
ezplot(s.y)
>> hold off
两条曲线区别:
findobj:查找具有特定属性的图形对象
ezplot(s.x),set(findobj('type','line'),'color','r')
>> hold on
>> ezplot(s.y)
h=get(gca,'children');
set(h(1),'linestyle','--')
>> syms x(t) p(t);
>> eqn=[2*diff(x,t,2)+diff(x,t)+8*x==0,diff(p,t)==-p-8*x];
>> Dx=diff(x,t);
>> cond=[x(0)==2,Dx(0)==0;p(0)==0];
错误使用 sym/cat>checkDimensions (第 68 行)
CAT arguments dimensions not consistent.出错 sym/cat>catMany (第 33 行)
[resz, ranges] = checkDimensions(sz,dim);出错 sym/cat (第 25 行)
ySym = catMany(dim, args);出错 sym/vertcat (第 19 行)
ySym = cat(1,args{:});
>> cond=[x(0)==2,Dx(0)==0,p(0)==0];
>> s=dsolve(eqn,cond)s =
包含以下字段的 struct:
p: [1×1 sym]
x: [1×1 sym]>> p=s.p
p =
(16*exp(-t))/9 - (32*7^(1/2)*((11*exp(-t/4)*sin((3*7^(1/2)*t)/4))/6 + (7^(1/2)*exp(-t/4)*cos((3*7^(1/2)*t)/4))/6))/21
>> x=s.x
x =
(32*7^(1/2)*((exp(-t/4)*sin((3*7^(1/2)*t)/4))/16 + (3*7^(1/2)*exp(-t/4)*cos((3*7^(1/2)*t)/4))/16))/21
>> ezplot(s.x),set(findobj('type','line'),'color','r')
>> hold on
>> ezplot(s.p)
>> h=get(gca,'children');
>> set(h(1),'linestyle','--')
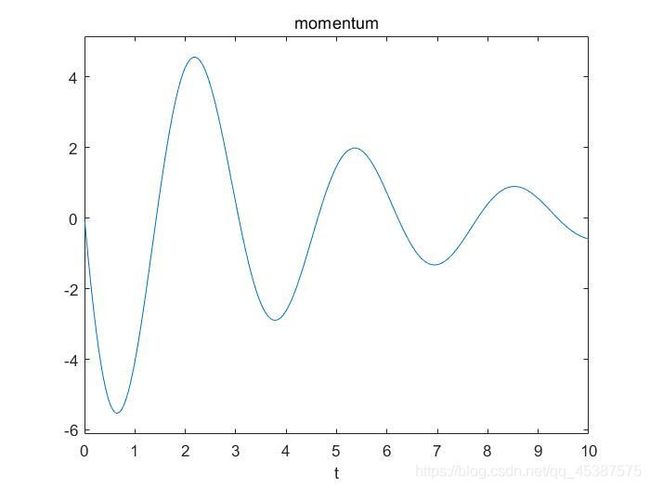
>> ezplot(s.x,[0,10])
>> title('position of mass')>> ezplot(s.p,[0 10])
>> title('momentum')
相平面图
>> ezplot(s.x,s.p,[-5 5])
>> title('parametric plot')
>> axis([-8 8 -25 20])
tvalue=(0:0.1:10);
xval=subs(s.x,'t',tvalue);
pval=subs(s.p,'t',tvalue);
>> plot(xval,pval),xlabel('x'),ylabel('p'),title('phase portrait for mass-spring')
>> syms x(t) p(t);
>> eqn=[diff(x,t,2)+diff(x,t)+(1/4)*x==0,diff(p,t)=-0.5*p-(1/4)*x];
eqn=[diff(x,t,2)+diff(x,t)+(1/4)*x==0,diff(p,t)=-0.5*p-(1/4)*x];
↑
错误: '=' 运算符的使用不正确。要为变量赋值,请使用 '='。要比较值是否相等,请使用
'=='。>>syms x(t) p(t);
eqn=[diff(x,t,2)+diff(x,t)+(1/4)*x==0,diff(p,t)==-0.5*p-(1/4)*x];
Dx=diff(x,t);cond=[x(0)==4,Dx(0)==0,p(0)==0];
s=dsolve(eqn,cond)s =
包含以下字段的 struct:
p: [1×1 sym]
x: [1×1 sym]>> ezplot(s.p)
>> hold on
>> ezplot(s.x)
tvalue=(0:0.1:20);
xval=subs(s.x,'t',tvalue);
pval=subs(s.p,'t',tvalue);
plot(xval,pval),xlabel('x'),ylabel('p'),title('phase portrait for mass-spring')
求极限
>> syms x
>> g=(sin(4*x))/x;
>> t=limt(g,0)
函数或变量 'limt' 无法识别。
是不是想输入:
>> t=limit(g,0)
t =
4
判断函数在某点的极限值是否存在-左右极限
>> syms x;
>> g=(x-2)/abs(x-2);
t1=limit(g,2,'left')
错误使用 sym/limit (第 56 行)
Limit variable must be a symbolic variable.
>> t1=limit((x-2)/abs(x-2),2,'left')
错误使用 sym/limit (第 56 行)
Limit variable must be a symbolic variable.
>> t1=limit((x-2)/abs(x-2),x,2,'left')
t1 =
-1
>> t2=limit((x-2)/abs(x-2),x,2,'right')
t2 =
1
寻找渐近线并绘制出来
>> syms x;
>> g=x/(x^2-3*x);
>> ezplot(g)
>> hold on
>> plot([3 3],[-2 2],'--')
计算极限:
>> syms theta;
>> g=cos(theta)/(1+sin(theta));
>> t1=limit(g,theta,pi/2)
t1 =
0
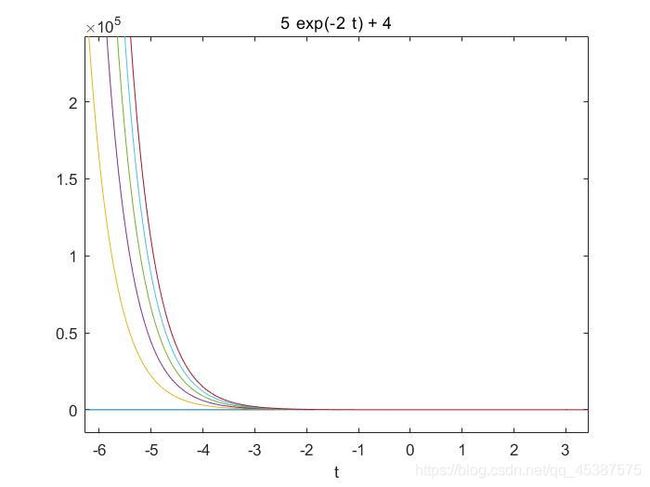
>> syms x(t);
>> eqn=diff(x,t)==-2*x+8;
>> for i=1:1:5
s=dsolve(eqn);
x=subs(s,'C1',i);
ezplot(x)
hold on
end
>> syms x(t) p(t);
>> eqn=[diff(x,t,2)+2*diff(x,t)+x==0,diff(p,t)==x];
>> Dx=diff(x,t);
>> cond=[Dx(0)==0,p(0)==0];
>> s=dsolve(eqn,cond)s =
包含以下字段的 struct:
p: [1×1 sym]
x: [1×1 sym]>> tvalue=(0:0.1:10);
xval=subs(s.x,'t',tvalue);
pval=subs(s.p,'t',tvalue);
>> plot(xval,pval),xlabel('x'),ylabel('p'),title('phase portrait for mass-spring')
错误使用 plot
数据必须为可转换为双精度值的数值、日期时间、持续时间或数组。
>> plot(pval,xval),xlabel('p'),ylabel('x'),title('phase portrait for mass-spring')
错误使用 plot
数据必须为可转换为双精度值的数值、日期时间、持续时间或数组。
不知道怎么绘制相位图????????
少写了一个初始值
syms x(t) p(t);
eqn=[diff(x,t,2)+2*diff(x,t)+x==0,diff(p,t)==x];
Dx=diff(x,t);
cond=[Dx(0)==0,p(0)==0,x(0)==1];
s=dsolve(eqn,cond)s =
包含以下字段的 struct:
p: [1×1 sym]
x: [1×1 sym]
tvalue=(0:0.1:10);
xval=subs(s.x,'t',tvalue);
pval=subs(s.p,'t',tvalue);
>> plot(xval,pval),xlabel('x'),ylabel('p'),title('phase portrait for mass-spring')


