泰坦尼克号获救预测——数据处理分析部分
泰坦尼克号获救预测——数据处理分析部分
- 一·背景介绍
- 二·数据预处理
-
- 导入数据
- 粗略观察数据
- 数据清洗
一·背景介绍
泰坦尼克号于1909年3月31日在爱尔兰动工建造,1911年5月31日下水,次年4月2日完工试航。她是当时世界上体积最庞大、内部设施最豪华的客运轮船,有“永不沉没”的美誉。然而讽刺的是,泰坦尼克号首航便遭遇厄运:1912年4月10日, 她从英国南安普顿(Southampton)出发,途径法国瑟堡(Cherbourg)和爱尔兰昆士敦(Queenston),驶向美国纽约。在14日晚23时40分左右,泰坦尼克号与一座冰山相撞,导致船体裂缝进水。次日凌晨2时20分左右,泰坦尼克号断为两截后沉入大西洋,其搭载的2224名船员及乘客,在本次海难中逾1500人丧生。
数据源:数据
二·数据预处理
以下代码默认导入下面的库
import numpy as np
import pandas as pd
import matplotlib.pyplot as plt
import seaborn as sns
import warnings
warnings.filterwarnings('ignore')
导入数据
df_train = pd.read_csv('./datasets/train.csv')
df_test = pd.read_csv('./datasets/test.csv')
df_all = pd.concat([df_train, df_test]).reset_index(drop=True)
df_all.describe()

df_all.info()
df_all.head(5)
<class 'pandas.core.frame.DataFrame'>
RangeIndex: 1309 entries, 0 to 1308
Data columns (total 12 columns):
 #   Column       Non-Null Count  Dtype
---  ------       --------------  -----
 0   PassengerId  1309 non-null   int64
 1   Survived     891 non-null    float64
 2   Pclass       1309 non-null   int64
 3   Name         1309 non-null   object
 4   Sex          1309 non-null   object
 5   Age          1046 non-null   float64
 6   SibSp        1309 non-null   int64
 7   Parch        1309 non-null   int64
 8   Ticket       1309 non-null   object
 9   Fare         1308 non-null   float64
 10  Cabin        295 non-null    object
 11  Embarked     1307 non-null   object
dtypes: float64(3), int64(4), object(5)
memory usage: 122.8+ KB
粗略观察数据
# 单特征展示Have a glance at data
import math


def plot_distribution(dataset, cols=5, width=20, height=15, hspace=0.2, wspace=0.5):
    plt.style.use('seaborn-whitegrid')
    fig = plt.figure(figsize=(width, height))
    fig.subplots_adjust(left=None, bottom=None, right=None, top=None, wspace=wspace, hspace=hspace)
    rows = math.ceil(float(dataset.shape[1]) / cols)

    for i, column in enumerate(dataset.columns):
        ax = fig.add_subplot(rows, cols, i + 1)
        # ax.set_title(column)
        plt.xlabel(column, fontsize=20)
        plt.ylabel('', fontsize=20)
        plt.xticks(fontsize=15)
        plt.yticks(fontsize=15)
        if dataset.dtypes[column] == np.object:
            g = sns.countplot(y=column, data=dataset, palette='plasma')
            plt.xticks(rotation=25)
        else:
            # 直方图,频数

            g = sns.distplot(dataset[column], kde_kws={'bw': 0.1})
            plt.ylabel(ylabel='Density', fontsize=20)
            plt.xticks(rotation=25)
plot_distribution(df_all[['Age', 'Cabin', 'Embarked', 'Fare', 'Parch', 'Pclass', 'Sex', 'SibSp', 'Survived']], cols=3,
                  width=20, height=20, hspace=0.45, wspace=0.5)
查看在不同获救情况下,性别与年龄之间的关系
fig = plt.figure(figsize=(15, 8))
plt.subplot(2, 2, 1)
sns.violinplot(data=df_all, x="Sex", y="Age", hue="Survived",
               split=True, inner="quart", linewidth=1,
               palette={1: "#04A699", 0: ".85"})
sns.despine(left=True)
plt.subplot(2, 2, 2)
sns.violinplot(data=df_all, x="Sex", y="Pclass", hue="Survived",
               split=True, inner="quart", linewidth=1,
               palette={1: "#04A699", 0: ".85"})
sns.despine(left=True)
plt.subplot(2, 2, 3)
sns.violinplot(data=df_all, x="Sex", y="SibSp", hue="Survived",
               split=True, inner="quart", linewidth=1,
               palette={1: "#04A699", 0: ".85"})
sns.despine(left=True)
plt.subplot(2, 2, 4)
sns.violinplot(data=df_all, x="Sex", y="Parch", hue="Survived",
               split=True, inner="quart", linewidth=1,
               palette={1: "#04A699", 0: ".85"})
sns.despine(left=True)
由上图可以得出以下结论:
- 不同生存情况下,男女性别在年龄分布中相似。
- 不同舱位生存比例不一,男女各舱位分布相似。
- 女性获救乘员中,兄弟姐妹的影响似乎很大。
因此,下面我们着重看一下Pclass与生存的关系
Pclass和生存率
s_pclass= df_all['Survived'].groupby(df_all['Pclass'])
s_pclass = s_pclass.value_counts().unstack()
s_pclass= s_pclass[[1.0,0.0]]
s_pclass.plot(kind='bar',stacked = True, colormap='tab20c')
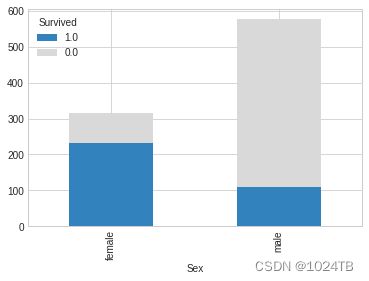
Sex和生存率
s_sex = df_all['Survived'].groupby(df_all['Sex'])
s_sex = s_sex.value_counts().unstack()
s_sex = s_sex[[1.0,0.0]]
ax = s_sex.plot(kind='bar',stacked=True,colormap='tab20c')

男性乘客幸存率远小于女性,看过电影的读者应该都知道电影中说到妇女和儿童优先。
综合性别和舱位两个变量来观察对生存率的影响
sns.catplot(x="Pclass",y='Survived', hue="Sex", kind="point",
            palette="pastel", edgecolor=".6",
            data=df_all)
数据清洗
处理Emabarked缺失值
df_all['Embarked'] = df_all['Embarked'].fillna('S')
df_all['Embarked'].head()
处理Cabin缺失值
df_all['Cabin']=df_all['Cabin'].fillna('U')
df_all['Cabin'].head()
处理Fare缺失值
#查看缺失值
df_all[df_all['Fare'].isnull()]
#假设船票价和Cabin,Pclass以及Embarked有关(按照常理推断)
df_all['Fare']=df_all['Fare'].fillna(df_all[(df_all['Pclass']==3)&(df_all['Embarked']=='S')&(df_all['Cabin']=='U')]['Fare'].mean())
处理Age缺失值
因为Age项缺失较多,所以不能直接将其填充为众数或者平均数。常见有两种填充法,一是根据Title项中的Mr、Master、Miss等称呼的平均年龄填充,或者综合几项(Sex、Title、Pclass)的Age均值。二是利用其他组特征量,采用机器学习算法来预测Age,本例采用的是第二种方法
#将Age完整的项作为训练集、将Age缺失的项作为测试集。
missing_age_df = df_all.iloc[:,[1,2,4,5,6,7,8,9,10,11]]
missing_age_df['Sex']= missing_age_df['Sex'].factorize()[0]
missing_age_df['Embarked']= missing_age_df['Embarked'].factorize()[0]
missing_age_df['Cabin']= missing_age_df['Cabin'].factorize()[0]
missing_age_df.corr()['Age'].sort_values(0)
Pclass     -0.408106
SibSp      -0.243699
Parch      -0.150917
Survived   -0.077221
Sex        -0.063645
Embarked    0.047410
Fare        0.177531
Cabin       0.272991
Age         1.000000
Name: Age, dtype: float64
missing_age_df = pd.DataFrame(missing_age_df[['Age', 'Parch','SibSp','Fare', 'Pclass','Cabin']])
#拆分训练集和测试集
age_train=missing_age_df[missing_age_df['Age'].notnull()]
age_test=missing_age_df[missing_age_df['Age'].isnull()]

#生成训练数据的特征和标签
age_train_X=age_train.drop(['Age'],axis=1)
age_train_y=age_train['Age']
#生成测试数据的特征
age_test_X=age_test.drop(['Age'],axis=1)

#利用随机森林构建模型
from sklearn.ensemble import RandomForestRegressor
rfr=RandomForestRegressor(random_state=0, n_estimators=2000, n_jobs=-1)
rfr.fit(age_train_X,age_train_y)

#模型得分
print('模型得分:',rfr.score(age_train_X,age_train_y))
模型得分: 0.6873493620999973
填补完age来看一下age对生存的影响
df_all['Age'] = df_all['Age'].astype(int)
plt.style.use('seaborn-whitegrid')
fig = plt.figure(figsize=(30,5))
sns.barplot(x="Age", y='Survived',data=df_all,palette='plasma');


