多传感器融合定位-常用辅助调试工具总结
多传感器融合定位-常用辅助调试工具总结
前言:多传感器融合定位调试过程中,会用到很多调试方法,诸如open3d可视化,matplotlib波形可视化,本章节进行汇众,持续更新~
调试方法汇总
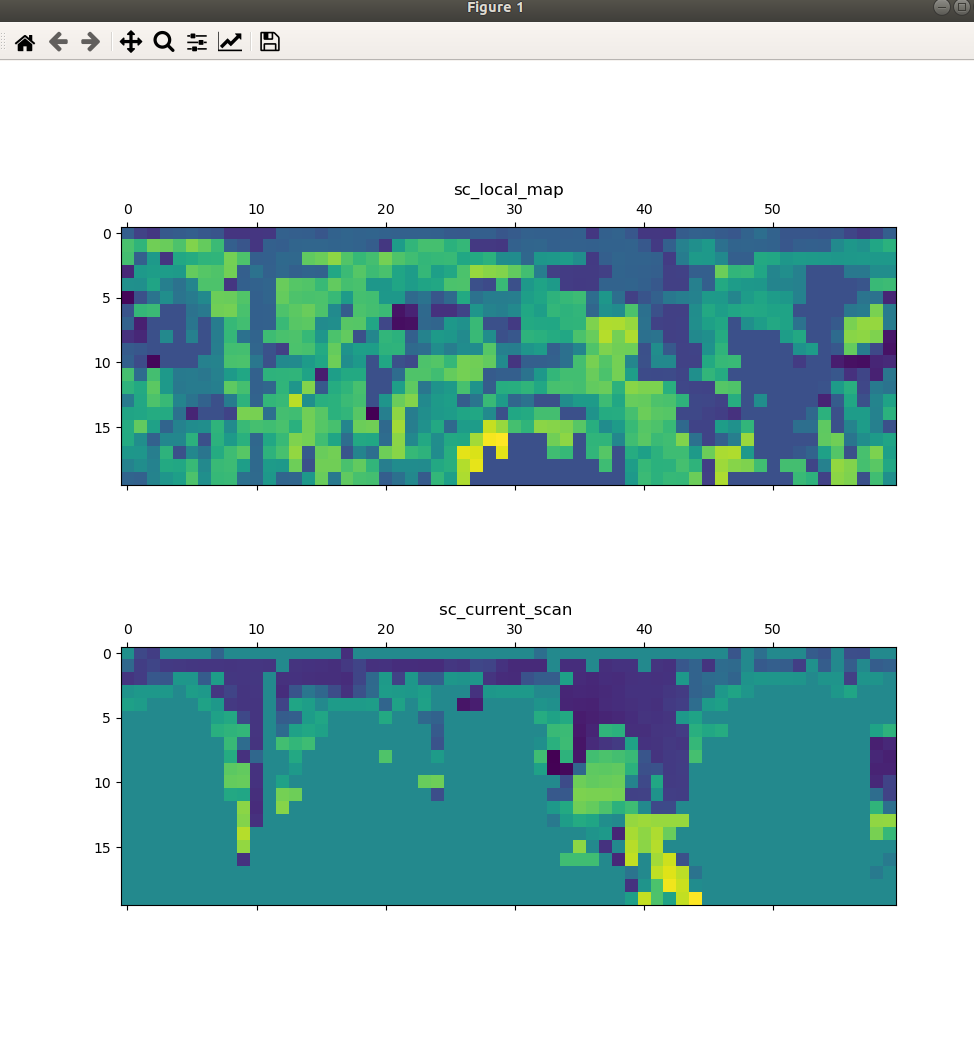
1. mamtplotlib可视化scan_context矩阵
存储scan_context 矩阵都txt文件中
#include
#include 调用方法:
    Eigen::MatrixXf   sc_matrix(query_scan_context.rows(), query_scan_context.cols());				// 将sc存到sc_matrix 中
    for(int did = 0; did < query_scan_context.rows();  ++ did){
        for(int sid = 0; sid < query_scan_context.cols(); ++sid){
            sc_matrix(did,sid)  =   query_scan_context(did,sid);
        }
    }
CreateFile(sc_local_map, sc_local_map_path);   //  创建文件夹
    WriteText(sc_local_map, sc_matrix);             // 把 sc_matrxi_local_map  写进文件夹中
python matplotlib 读取sc_matrix 并可视化矩阵
import matplotlib.pyplot as plt
import numpy as np

sc_matrix_cur_scan = np.loadtxt("sc_matrix_cur_scan.txt")
sc_matrix_lcoal_map = np.loadtxt("sc_matrix_local_map.txt")

def samplemat(mat):
    """Make a matrix with all zeros and increasing elements on the diagonal"""
    sector = mat.shape[0]   # x
    ring = mat.shape[1]     # y
    aa = np.zeros((sector,ring))
    for i in range(sector):
        for j in range(ring):
            if(mat[i,j]):
                aa[i,j]  = 1 #mat[i,j]
            else:
                aa[i, j] = mat[i,j]
    return aa

fig = plt.figure(figsize=(10,10))
ax1 =  fig.add_subplot(2,1,1)          # 2*1 分布,第1个

# Display matrix
#ax1.matshow(samplemat(sc_matrix_lcoal_map))   #,cmap = plt.cm.gray
ax1.matshow(sc_matrix_lcoal_map)   #,cmap = plt.cm.gray
plt.title("sc_local_map");

ax2 =  fig.add_subplot(2,1,2)          # 2*1 分布,第2个
#ax2.matshow(samplemat(sc_matrix_cur_scan))   #,cmap = plt.cm.gray
 ax2.matshow(sc_matrix_cur_scan)   #,cmap = plt.cm.gray
plt.title("sc_current_scan ");

plt.show()
2. open3d可视化点云
存储点云为pcd
pcl::io::savePCDFileASCII("/home/kaho/catkin2_ws/visual_sc_matrix/pcd/cur_scan.pcd",*transformed_scan_.cloud_ptr );
//save pcd
 pcl::io::savePCDFileASCII("/home/kaho/catkin2_ws/visual_sc_matrix/pcd/local_map.pcd",*local_map_ptr_ );
python open3d 可视化
import open3d as o3d
import numpy as np
local_map_pcd = o3d.io.read_point_cloud("pcd/local_map.pcd")
cur_scan_pcd = o3d.io.read_point_cloud("pcd/cur_scan.pcd")

local_map_points = np.asarray(local_map_pcd.points)
cur_scan_points = np.asarray(cur_scan_pcd.points)


# print(local_map_pcd)#输出点云点的个数
# print(cur_scan_pcd)#输出点云点的个数
#
print(local_map_points)#输出点的三维坐标
# print(cur_scan_points)#输出点的三维坐标
#
# print('给所有的点上一个统一的颜色,颜色是在RGB空间得[0,1]范围内得值')

local_map_pcd.paint_uniform_color([0.9, 0.9, 0.9])        # blue
cur_scan_pcd.paint_uniform_color([1, 0, 0])        # red


o3d.visualization.draw_geometries([local_map_pcd,cur_scan_pcd])

3. evo 格式存储 pose
FILE:catkin_ws/src/imu_integration/src/evo_evaluate/evaluate.cpp
使用evo工具进行精度评估,evo format 使用TUM格式,参考了eamo 助教的GitHub写法,为了方便后续调用,将保存文件格式写成ROS Node的方式,通过订阅:
/sim/sensor/imu /pose/ground_truth 两个话题,存储到对应格式的文件中,进行 evo 评估。
evo的使用方式可参考:
SLAM轨迹精度评估工具evo使用方法
evo测评TUM数据集
evo安装、evo使用方法详细介绍使用教程,SLAM轨迹精度评估工具,如何用来评估ORB-SLAM2生成的轨迹精度,评估激光雷达SLAM与视觉SLAM的轨迹精度,量化SLAM的误差
3.1 evo TUM格式存储
常用的evo KITTI pose format是美誉timestamp的,通过固定序列数来进行精度评估比较,TUM 数据集 format中有时间戳,通过时间戳来比较,会比较准,所以本次存储的evo数据格式为TUM
evo TUM需要pose 存储格式为 timestamp x y z q_x q_y q_z q_w ;具体参考evo 官档Formats
存储写法
/* write2txt   format  TUM*/
void WriteText(std::ofstream& ofs, pose data){
    ofs << std::fixed  << data.timestamp  << " " << data.pos.x() << " " <<  data.pos.y()  << " " <<   data.pos.z()  << " "
                                                                              <<  data.q.x()  << " "  <<  data.q.y()   <<" " <<  data.q.z()   << " "  <<  data.q.w()  <<  std::endl;
}
3.2 TUM timestamps时间对齐
一开始,给gt.txt 和 ins.txt 中写上timestamps时,时间戳都是各自的ROS topic的时间戳,运行evo_rpe 分段评估时,报错,找不到两个文件中时间戳相差0.01s的数据,经过观察,因为estimate imu惯性解算节点是先通过订阅imu_sim topic 数据才进行解算,会比groundtruth topic 时间戳显示慢一点,因此将各自当前时间戳减去第一帧的数据时间戳,就可以对齐各自的时间。
    if(flag_ins){
        stamp_ins_init  =  msg->header.stamp.toSec();
        flag_ins = 0;
    }
    pose_ins.timestamp =  msg->header.stamp.toSec()  -   stamp_ins_init;  //把时间戳转化成浮点型格式

/******************************************************************************************************/
        if(flag_gt){
        stamp_gt_init = msg->header.stamp.toSec();
        flag_gt = 0;
    }
        pose_gt.timestamp = msg->header.stamp.toSec() -  stamp_gt_init;
3.3 evo TUM ROS_Node 完整实现
FILE:catkin_ws/src/imu_integration/src/evo_evaluate/evaluate.cpp
#include
#include 4.Mapviz 做GPS 里程计可视化
主要参考博客:
代凯哥的知乎博客:
惯性导航系统INS570D测试
Mapviz来做GPS+里程计+LiDAR可视化
4.1.mapviz 安装
参考 : 使用Mapviz、中科图新 进行机器人GPS轨迹卫星地图绘制
4.2.mapviz 调用天地图api
因为mapviz默认加载的地图为Stamen的地图,为外国网站,所以加载很慢,在代凯博士的指点下,选择使用天地图的WMTS-api,进行切片地图的显示,并在上面显示轨迹
4.2.1申请天地图API key 个人密钥
需要先申请天地图API KEY,注意申请时,选择的应用类型为:服务端,提交后就能生成自己的tk 密钥。
 地图API
地图API
4.2.2地图瓦片获取格式
按照地图API的格式,写入你的密钥
格式:
http://t0.tianditu.gov.cn/img_w/wmts?SERVICE=WMTS&REQUEST=GetTile&VERSION=1.0.0&LAYER=img&STYLE=default&TILEMATRIXSET=w&FORMAT=tiles&TILEMATRIX={z}&TILEROW={x}&TILECOL={y}&tk=您的密钥
需要注意的是: 如下图所示,mapviz中,在tile_map 中,添加的Base URL 格式为
http://tile.stamen.com/terrain/{level}/{x}/{y}.png # level x y 分别表示 高经纬
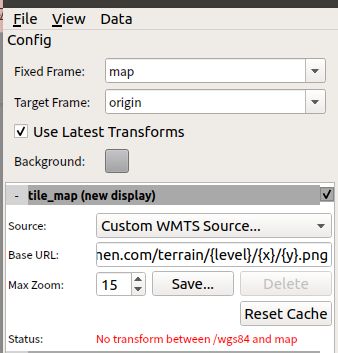
所以需要将天地图api调取格式中的 z 变量改为 level 变量,mapviz才能识别到,修改后的天地图api调取格式为
http://t0.tianditu.gov.cn/img_w/wmts?SERVICE=WMTS&REQUEST=GetTile&VERSION=1.0.0&LAYER=img&STYLE=default&TILEMATRIXSET=w&FORMAT=tiles&TILEMATRIX={level}&TILEROW={x}&TILECOL={y}&tk=您的密钥
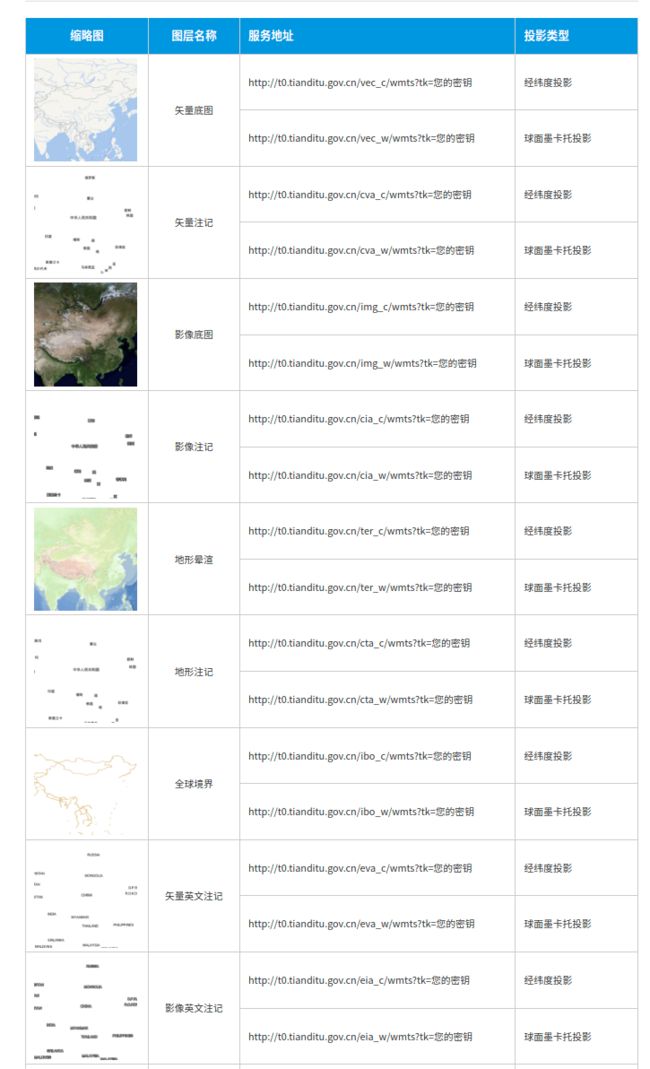
矢量底图
经纬度投影
http://t0.tianditu.gov.cn/vec_c/wmts?SERVICE=WMTS&REQUEST=GetTile&VERSION=1.0.0&LAYER=img&STYLE=default&TILEMATRIXSET=w&FORMAT=tiles&TILEMATRIX={level}&TILEROW={y}&TILECOL={x}&tk=您的密钥
球面墨卡托投影
http://t0.tianditu.gov.cn/vec_w/wmts?
SERVICE=WMTS&REQUEST=GetTile&VERSION=1.0.0&LAYER=img&STYLE=default&TILEMATRIXSET=w&FORMAT=tiles&TILEMATRIX={level}&TILEROW={y}&TILECOL={x}&tk=您的密钥
矢量注记
经纬度投影
http://t0.tianditu.gov.cn/cva_c/wmts?SERVICE=WMTS&REQUEST=GetTile&VERSION=1.0.0&LAYER=img&STYLE=default&TILEMATRIXSET=w&FORMAT=tiles&TILEMATRIX={level}&TILEROW={y}&TILECOL={x}&tk=您的密钥
球面墨卡托投影
http://t0.tianditu.gov.cn/cva_w/wmts?
SERVICE=WMTS&REQUEST=GetTile&VERSION=1.0.0&LAYER=img&STYLE=default&TILEMATRIXSET=w&FORMAT=tiles&TILEMATRIX={level}&TILEROW={y}&TILECOL={x}&tk=您的密钥
影像底图
经纬度投影
http://t0.tianditu.gov.cn/img_c/wmts?
SERVICE=WMTS&REQUEST=GetTile&VERSION=1.0.0&LAYER=img&STYLE=default&TILEMATRIXSET=w&FORMAT=tiles&TILEMATRIX={level}&TILEROW={y}&TILECOL={x}&tk=您的密钥
球面墨卡托投影
http://t0.tianditu.gov.cn/img_w/wmts?
SERVICE=WMTS&REQUEST=GetTile&VERSION=1.0.0&LAYER=img&STYLE=default&TILEMATRIXSET=w&FORMAT=tiles&TILEMATRIX={level}&TILEROW={y}&TILECOL={x}&tk=您的密钥
地形晕渲
经纬度投影
http://t0.tianditu.gov.cn/ter_c/wmts?
SERVICE=WMTS&REQUEST=GetTile&VERSION=1.0.0&LAYER=img&STYLE=default&TILEMATRIXSET=w&FORMAT=tiles&TILEMATRIX={level}&TILEROW={y}&TILECOL={x}&tk=您的密钥
球面墨卡托投影
http://t0.tianditu.gov.cn/ter_w/wmts?
SERVICE=WMTS&REQUEST=GetTile&VERSION=1.0.0&LAYER=img&STYLE=default&TILEMATRIXSET=w&FORMAT=tiles&TILEMATRIX={level}&TILEROW={y}&TILECOL={x}&tk=您的密钥
三维地形影像底图
https://[ t0-t7 ].tianditu.gov.cn/mapservice/swdx?
SERVICE=WMTS&REQUEST=GetTile&VERSION=1.0.0&LAYER=img&STYLE=default&TILEMATRIXSET=w&FORMAT=tiles&TILEMATRIX={level}&TILEROW={y}&TILECOL={x}&tk=您的密钥
4.3.使用
4.3.1 添加 Custom WMTS Source
例如,使用 影像底图-球面墨卡托投影,往Base URL 里添加天地图URL+密钥,Max zoom 选择99 ,加大分辨率
http://t0.tianditu.gov.cn/img_w/wmts?SERVICE=WMTS&REQUEST=GetTile&VERSION=1.0.0&LAYER=img&STYLE=default&TILEMATRIXSET=w&FORMAT=tiles&TILEMATRIX={level}&TILEROW={y}&TILECOL={x}&tk=您的密钥
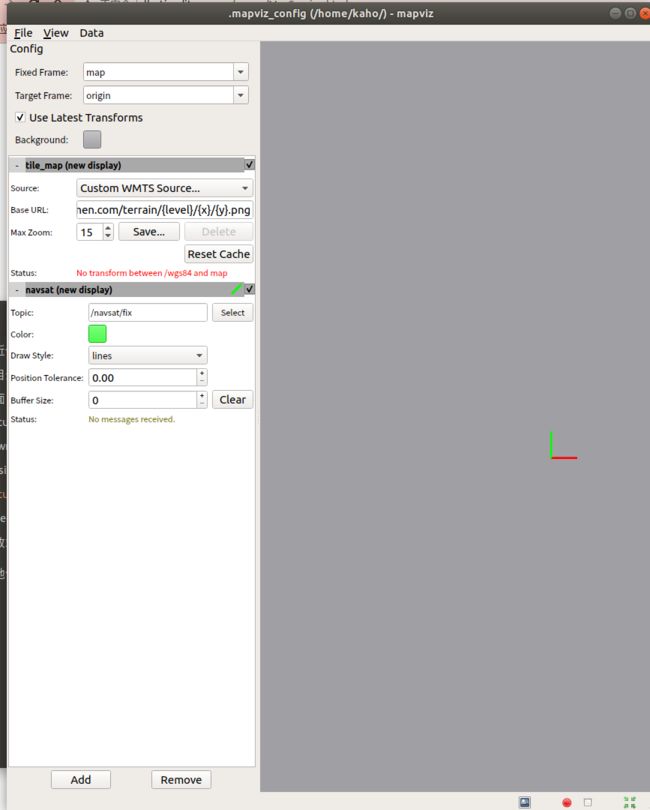
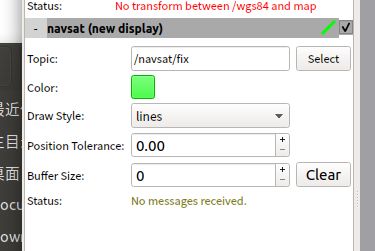
4.3.2 添加 navsat 路径display
选择/navsat/fix 话题和适当的颜色,即可在卫星地图上绘制路径
注意,mapviz中要先添加tile_map 再 添加 navsat(new display)
4.3.3 播放数据集
3.3.4 最后效果
如下图所示,红色轨迹为在广场的轨迹路线图
edited by kaho 12.5