Python | 数据可视化汇总
01 提纲
不断总结是学习进步的阶梯。
前阵子针对python数据可视化进行了一波学习和实操,是时候总结一下数据可视化的方法和代码了,一起来复习吧!
想要说明的一点是,方法千千万,是学习不完的,怎么办呢?
最近听到一个词:用以致学。就是以目的为导向去学习,学到之后再进行总结,而不是盲目地学。
本次数据可视化复习提纲如下:
- 散点图
- 箱线图
- 折线图
- 条形图、直方图
- 饼图
- 多图
主要使用到matplotlib.pyplot和seaborn两个python内置绘图包。
下面我们开始吧~
对了,别忘记引入包
import matplotlib.pyplot as plt
import seaborn as sns
import numpy as np
import pandas as pd

#设置在notebook中直接展示图形输出
%matplotlib inline
#设置图片清晰度
%config InlineBackend.figure_format="retina"
02 散点图
【.plot作图】
# kind="scatter",做散点图,x轴表示花瓣长度,y轴表示花瓣宽度
iris.plot(kind="scatter",color="red",x="petal_length",y="petal_width")
【matlibplot.pyplot.plot作图】 [plt.plot( )]
plt.style.use('ggplot')

#设置画布大小
plt.figure(figsize=(8,6))

#scatter绘制散点图,s设置点大小
plt.scatter(x=top10.Purchases,y=top10.Sales,s=100)
【seaborn作图】[sns.] v.s. 【.plt作图】
- matplotlib是python的主要绘图工具,但其自身的语法比较复杂
- Seaborn是基于matplotlib产生的一个模块,专攻于统计可视化
- Seaborn和matplotlib的关系类似于pandas和numpy的关系
我们来看看seaborn相较于plt的简洁之处,下面两个代码实现同样的效果——花瓣长宽散点图,以品种划分数据.
seaborn实现
# FacetGrid中的hue参数指明划分数据的变量,这里是species(品种)
# \ 用于将一行语句提行
# add_legend()添加图例
#先将iris数据集以species字段划分开

sns.FacetGrid(iris,hue='species',size=7)\
.map(plt.scatter,'petal_length','petal_width').add_legend()
plt实现
# 使用布尔型索引,分别获取三种类型鸢尾花的数据集
setosa=iris[iris.species=="Iris-setosa"]
versicolor=iris[iris.species=="Iris-versicolor"]
virginica=iris[iris.species=="Iris-virginica"]

#作图,setosa数据散点图ax
bx = setosa.plot(kind="scatter",x="petal_length",y="petal_width",color="red",label="setosa",figsize=(10,6))
#将其余两种类型的花数据也作图在ax上
versicolor.plot(ax=bx,kind="scatter",x="petal_length",y="petal_width",color="blue",label="versicolor")
virginica.plot(ax=bx,kind="scatter",x="petal_length",y="petal_width",color="yellow",label="virginica")
03 箱线图
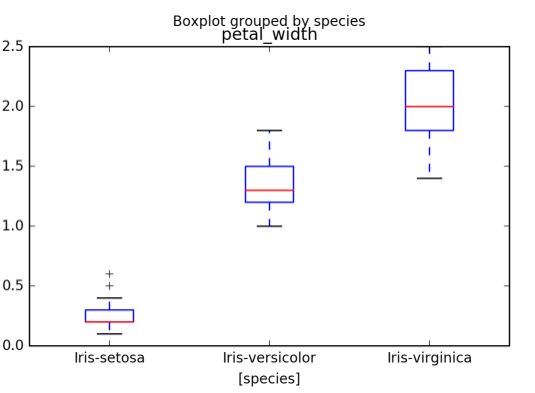
箱线图体现数据的最大、最小值,中位数、上下四分位数,是一个数据集的统计结果可视化。
【.plot作图】
# 指定某列数据,作单个箱线图
# kind="box"作箱图
iris.petal_width.plot(kind="box",label="iris",figsize=(8,4))
【seaborn作图】[sns.]
# 花萼宽度箱线图,以品种划分数据
sns.boxplot(data=iris,x='species',y='sepal_width')

#下面语句实现与sns.boxplot一样的效果
iris[["sepal_width","species"]].boxplot(grid=False,by="species")
04 折线图
【matlibplot.pyplot.plot作图】 [plt.]
plt拥有很多内置函数可调用,对于美化图片、设置标识等都比较方便。
#绘制折线图
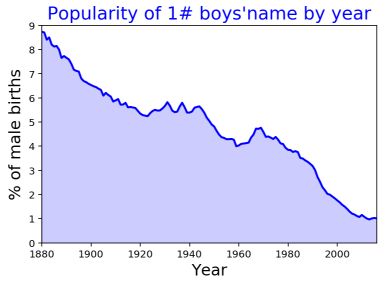
plt.plot(rank1m.year,rank1m.pct,color="blue",linewidth=2)

#plt.fill_between设置填充线与坐标轴之间的空间
plt.fill_between(rank1m.year,rank1m.pct,color="blue",alpha=0.2)

#设置坐标轴区间范围
plt.xlim(1880,2016)
plt.ylim(0,9)

#美化图:给图添加标题,调整字体大小等
plt.title("Popularity of 1# boys'name by year",size=18,color="blue")
plt.xlabel("Year",size=16)
plt.ylabel("% of male births",size=16)
05 条形图、直方图
【matlibplot.pyplot.plot作图】 [plt.]
barh-水平条形图
bar-垂直条形图
hist-直方图
绘制水平条形图
plt.style.use('ggplot')

#barh绘制水平条形图;bar绘制垂直直方图
"""注意,条形图条数np.arange(10),要与top10.Sales数据数量一致,否则会报错-形状不匹(shape mismatch)"""
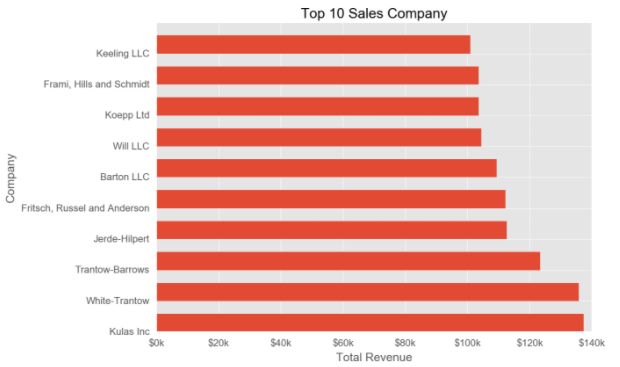
plt.barh(np.arange(10),top10.Sales,height=0.6)

#添加标题
plt.title('Top 10 Sales Company')
plt.xlabel('Total Revenue')
plt.ylabel('Company')

#修改纵坐标、横坐标刻度
'''此语句,可用tick_label=top10.Company替代,替代语句放在plt.barh()参数中
例如:plt.barh(np.arange(10),top10.Sales,tick_label=top10.Company,height=0.8) '''
plt.yticks(np.arange(10),top10.Company)
plt.xticks([0,20000,40000,60000,80000,100000,120000,140000],
          ['$0k','$20k','$40k','$60k','$80k','$100k','$120k','$140k'])

plt.show()
绘制直方图
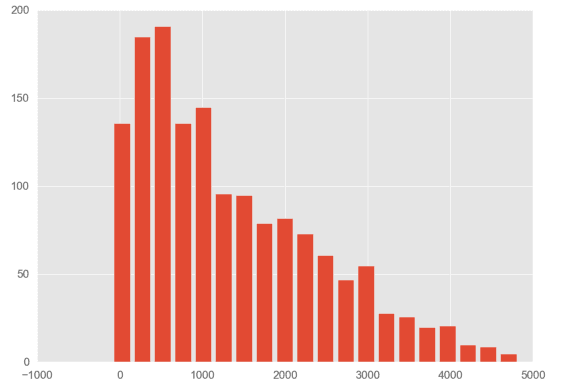
# 对于原始数据df中,每笔订单的交易额(ext price),统计单笔订单交易额分布情况

#hist绘制直方图,bins设置区间个数
plt.hist(df['ext price'],bins=20,rwidth=0.8)

plt.xlim(-200, 5000)
plt.show()
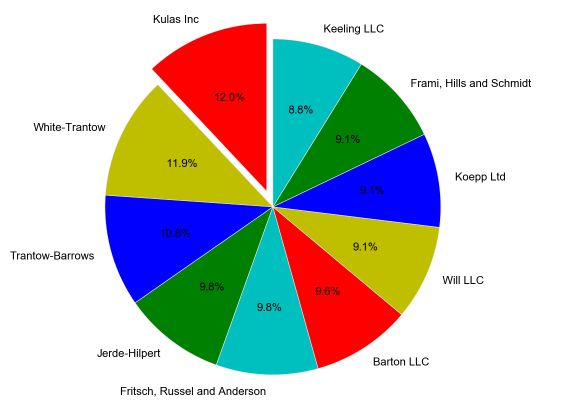
06 饼图
【matlibplot.pyplot.plot作图】 [plt.]
 #plt.pie()绘制饼图

"""

labels代表每个扇区的标签,

colors=['b','g'],设置扇区颜色

startangle代表起始位置角度

explode=(0.1,0,0,0,0,0,0,0,0,0)代表将第一个扇区拉出来0.1,作为突出显示

autopct='%1.1f%%',代表给出每个扇区的占比 ,精确到小数点后1位

"""

plt.pie(top10.Sales,labels=[top10.Company](http://top10.company/),

        colors=['r','y','b','g','c','r','y','b','g','c'],

        startangle=90,

        explode=(0.1,0,0,0,0,0,0,0,0,0),

        autopct='%1.1f%%')

#使饼图呈圆形

plt.axis('equal')
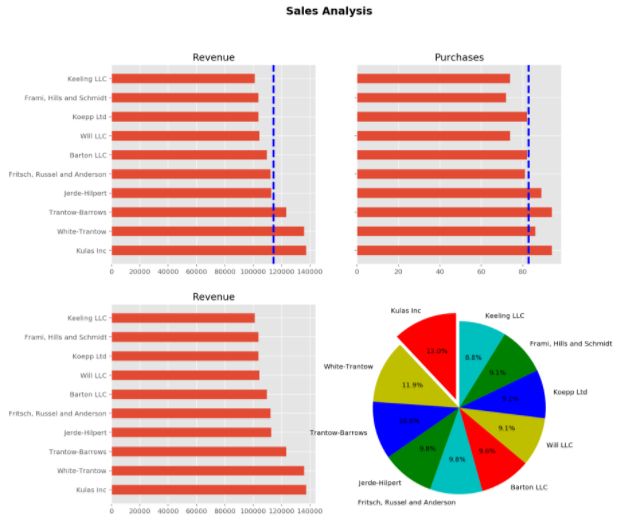
07 绘制多图
在一张画布上,绘制多张图片,更加方便对比分析。
【matlibplot.pyplot.plot作图】 [plt.]
plt.style.use('ggplot')
#设置画布大小
fig=plt.figure(figsize=(12,12))

#加上图像大标题
fig.suptitle('Sales Analysis',fontsize=16,fontweight='bold')

#fig.add_subplot(x,y,z),表示将画布分为x行,y列,当前图像放在从左到右、从上到下的第z个位置

#添加第一个子图
ax1=fig.add_subplot(2,2,1)
plt.barh(np.arange(10),top10.Sales,height=0.5,tick_label=top10.Company)
plt.title('Revenue')

#加入平均销售额线  plt.axvline()表示添加垂直线axis vertical line
revenue_avg=top10.Sales.mean()
plt.axvline(x=revenue_avg,color='b',linestyle='--',linewidth=3)


#添加第二个子图
ax2=fig.add_subplot(222)
plt.barh(np.arange(10),top10.Purchases,height=0.5)
plt.title('Purchases')

#设置不显示y轴刻度
plt.yticks(visible=False)

#加入平均订单数线
Purchases_avg=top10.Purchases.mean()
plt.axvline(x=Purchases_avg,color='b',linestyle='--',linewidth=3)

#加入第三个、第四个子图
ax3=fig.add_subplot(223)
plt.barh(np.arange(10),top10.Sales,height=0.5,tick_label=top10.Company)
plt.title('Revenue')

ax4=fig.add_subplot(224)
plt.pie(top10.Sales,labels=top10.Company,
        colors=['r','y','b','g','c','r','y','b','g','c'],
        startangle=90,
        explode=(0.1,0,0,0,0,0,0,0,0,0),
        autopct='%1.1f%%')
plt.axis('equal')

plt.show()
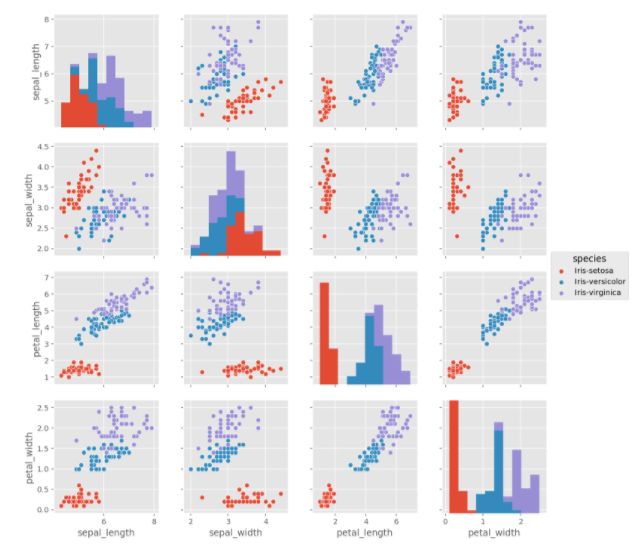
【seaborn作图】[sns.]
- sns.pairplot实现
- 用于快速观察各变量的分布情况,关系等
# 一条语句,展现4个变量之间的关系
# 分别展示了4个变量分布的直方图;以及两两变量之间的散点图

sns.pairplot(iris,hue='species')
08 总结
本文完整梳理了数据分析中常用的几种图的python绘制方法。
主要涉及到以下几种图的绘制:
- 散点图
- 箱线图
- 折线图
- 条形图、直方图
- 饼图
- 多图
主要使用到的绘图包
- matplotlib.pyplot
- seaborn
当然,条条大路通罗马,方法是学不完的,一定要以目的为导向学习技能,希望对你有帮助。


