Matplotlib基础(二)---- 图片与子图
Matplotlib基础(二)---- 图片与子图
在平时处理数据的时候,因为数据可视化更能显示数据的关系。而python中的matplotlib库很好地提供了我们2D绘图的方式。于是我打算系统且详细的学习matplotlib,并尽可能地总结各种用法。这个系列就是我我的学习经验总结。
上一篇我介绍了matplotlib库的开始用法: 1. matplotlib库的下载与导入 2. 三层结构的介绍 3. 绘图过程4. 图像的保存。应该都对matplotlib有了一点认识,这一篇,我将总结最常用的创建图片和子图的,以及相关的方法。
在创建目的图表之前,推荐两个Numpy库里的两个常用函数arange()和linspace()
1.arange(start, end, steps)
start,end为两个端点值,steps为步长值
2.linspace(start, end, nums)
start, end为两个端点值, nums为点数(切出几个距离相同的点)
创建图片
创建图片之前,应用到上一篇学到的,需先创建画布和坐标系,再plot出目标图像。
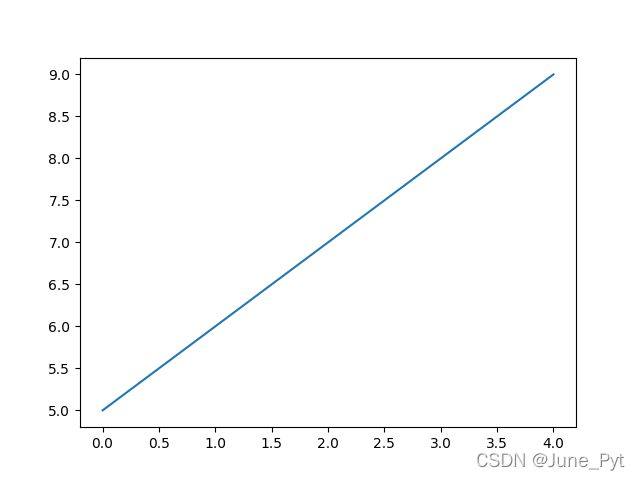
利用plot(x, y),传入必须的参数值x, y。(x和y必须为相同维度的数据,否则图像无法绘制出来)
实例如下:
import matplotlib.pyplot as plt

x = [0, 1, 2, 3, 4]
y = [5, 6, 7, 8, 9]
fig = plt.figure(dpi=100)
ax = plt.subplot(111)
ax.plot(x, y)
plt.show()
可以看出,当x, y是一定数量的数组时,matplotlib会数据点连成一条线。
同一坐标系中添加图像
如果需要在同一个坐标系中,绘制多个目标图像,可以使用多次plot()或者类似的函数。
import matplotlib.pyplot as plt

x = [0, 1, 2, 3, 4]
y1 = [5, 6, 7, 8, 9]
y2 = [0, 1, 2, 3, 4]
fig = plt.figure(dpi=100)
ax = plt.subplot(111)
ax.plot(x, y1)
ax.plot(x, y2)
plt.show()
创建子图
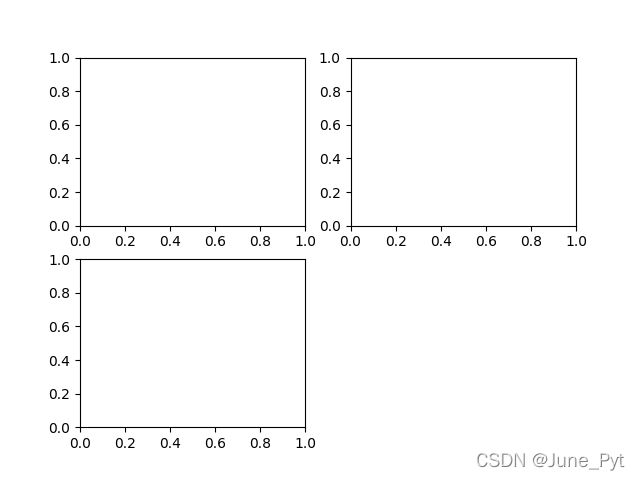
在一个画布中,可以用add_subplot()创建一个或多个子图(subplot),也就是创建多个坐标系。
fig = plt.figure()
ax1 = fig.add_subplot(2, 2, 1)
ax2 = fig.add_subplot(2, 2, 2)
ax3 = fig.add_subplot(2, 2, 3)
plt.show()
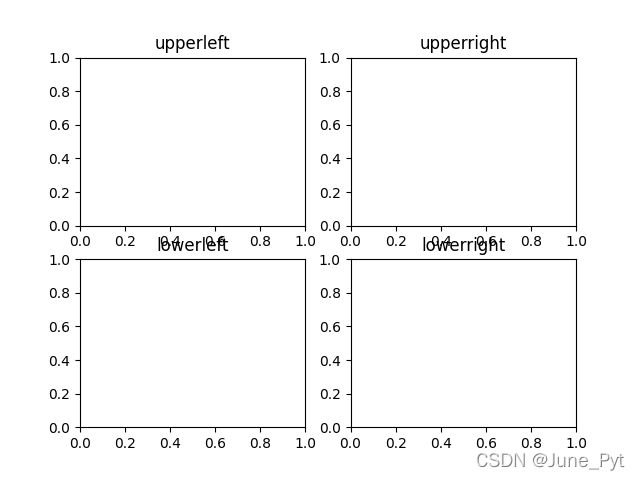
fig, axes = plt.subplots(nrows=2, ncols=2)
axes[0, 0].set(title='upperleft')
axes[0, 1].set(title='upperright')
axes[1, 0].set(title='lowerleft')
axes[1, 1].set(title='lowerright')
plt.show()
import matplotlib.pyplot as plt
import numpy as np

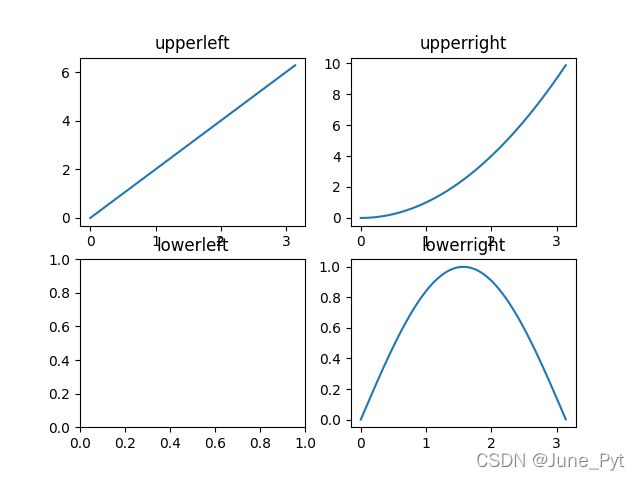
x = np.arange(0, np.pi, 0.01)
fig, axes = plt.subplots(nrows=2, ncols=2)
axes[0, 0].set(title='upperleft')
axes[0, 1].set(title='upperright')
axes[1, 0].set(title='lowerleft')
axes[1, 1].set(title='lowerright')
axes[0, 0].plot(x, 2*x)
axes[0, 1].plot(x, x**2)
axes[1, 1].plot(x, np.sin(x))
plt.show()
| 参数 | 描述 |
|---|---|
| nrows | 子图的行数 |
| ncols | 子图的列数 |
| sharex | 所有子图使用相同的x轴刻度(调整xlim会影响所有子图) |
| sharey | 所有子图使用相同的y轴刻度(调整ylim会影响所有子图) |
| subplot_kw | 传入add_subplot的关键字参数字典,用于生成子图 |
| **fig_kw | 在生成图片时使用的额外关键字参数,例如plt.subplots(2, 2, figsize=(8, 6)) |
总结:
- 了解创建图片和子图
- 了解如何一个坐标系创建多个图例
- 了解创建多个坐标系并作图


