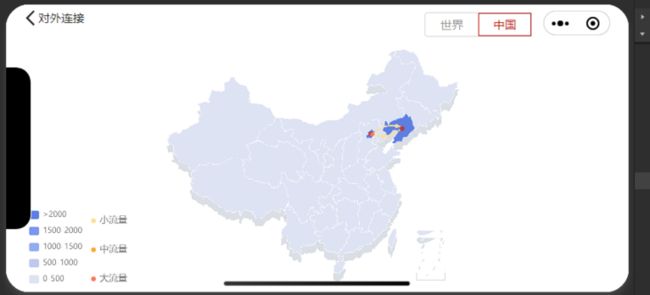
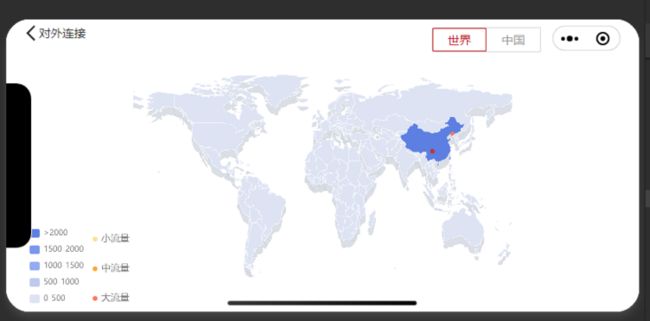
import * as echarts from '../../ec-canvas-map/echarts';
import geoJson from '../../mapFile/chinaJson.js';
const util = require('../../../utils/util.js');
const geoCoordMap = {
北京: [116.46, 39.92],
乌鲁木齐: [87.68, 43.77],
杭州: [120.19, 30.26],
兰州: [103.73, 36.03],
};
Component({
/**
* 组件的属性列表
*/
properties: {
conf: {
type: Object,
value: {}
}
},
/**
* 组件的初始数据
*/
data: {
isEmpty: false,
timer: 0,
ec: {
lazyLoad: true
}
},
ready: function () {
let _this = this;
var conf = _this.properties.conf;
var timerTime = conf.timerTime ? conf.timerTime : 0;
console.log("conf=====xxx", conf)
if (conf) {
_this.setData({
conf
});
// console.log(echarts.version);
_this.initEcharts()
}
if (timerTime != 0) {
this.setData({
timer: setInterval(function () {
this.initEcharts();
}, timerTime * 1000)
})
}
},
/**
* 组件的方法列表
*/
methods: {
//中国地图
initEcharts: function () {
var conf = this.properties.conf;
this.chartComponnet = this.selectComponent('#' + conf.id);
this.chartComponnet.init((canvas, width, height, dpr) => {
const chart = echarts.init(canvas, null, {
width: width,
height: height,
devicePixelRatio: dpr
});
echarts.registerMap('china', geoJson); // 绘制地图
chart.setOption(this.getChartOption());
return chart;
});
},
getChartOption: function () {
let conf = this.properties.conf;
let data = conf.data;
let visualReset = conf.visualMap, geoCoordMap = conf.geoCoordMap ? conf.geoCoordMap : {};
// console.log("组件获取到的值============", data, 'geoCoordMap======xx', geoCoordMap)
const colorArr = ["#FFE200", "#F9AB2E", "#FF7F4C"]; // 飞线色值组
let convertData = function (data) {
var res = [];
for (var i = 0; i < data.length; i++) {
var dataItem = data[i];
// debugger
var fromCoord = geoCoordMap[dataItem[0].name];
var toCoord = geoCoordMap[dataItem[1].name];
if (fromCoord && toCoord) {
res.push({
fromName: dataItem[0].name,
toName: dataItem[1].name,
coords: [fromCoord, toCoord],
color: colorArr[i]
});
}
}
return res;
};
// let items = convertData(data)
let firstDatas = [],
twoDatas = [],
threeDatas = [];
data.map(item => {
if (item[1] && item[1].value >= 2000) {
threeDatas.push(item);
} else if (item[1] && item[1].value > 1000 && item[1].value < 2000) {
twoDatas.push(item);
} else {
firstDatas.push(item);
}
})
var series = [{
type: 'map',
mapType: 'china',
aspectScale:conf.aspectScale ? conf.aspectScale : 0.9, // 比例
layoutCenter: ["50%", "38%"], // position位置
layoutSize: conf.layoutSize ? conf.layoutSize : '120%', // 地图大小,保证了不超过 370x370 的区域
// silent: true, // 禁止hover效果
center: conf.center ? conf.center : [105.194115019531, 36.582111640625],
label: {
// 图形上的文本标签
normal: {
show: false,
textStyle: {
color: "#E8E8E8",
fontSize: '8'
}
},
emphasis: { // 高亮时样式
color: "#333",
show: false
}
},
itemStyle: {
normal: {
// color: '#05C3F9',
// fontSize: '8',
// borderColor: '#fff',
// areaColor: "#000",
// areaColor: conf.areaColor ? conf.areaColor : "rgba(198,204,215,.65)",
borderColor: conf.borderColor ? conf.borderColor : '#fff',
// areaColor: conf.areaColor ? conf.areaColor : "#DEE3F3",
areaColor: conf.areaColor ? conf.areaColor : "rgba(198,204,215,.65)",
},
emphasis: {
areaColor: '#DEE3F3',//鼠标滑过区域颜色
color: '#DEE3F3' //悬浮背景
}
},
data: data.map(function (dataItem) {
console.log("dataItem=======xxxxxx", dataItem, dataItem[1])
return dataItem[1];
return dataItem;
})
}, ];
var linesSeries = [{
name: '小流量',
type: 'lines',
effect: {
show: true, //启用飞行效果
period: 6, //飞行速度
trailLength: 0.7, //飞行线的拖尾
color: '#FFDF90', //飞行线的颜色
symbolSize: 5 //飞行线的宽度
},
animation : true,
lineStyle: {
normal: {
color: '#FFDF90',
width: 1.6,
opacity: 0.5, //尾迹线条透明度
curveness: 0.3 //飞行线的弯曲程度
}
},
data: convertData(firstDatas)
},
{
name: '中流量',
type: 'lines',
effect: {
show: true, //启用飞行效果
period: 6, //飞行速度
trailLength: 0.7, //飞行线的拖尾
color: '#FFA535', //飞行线的颜色
symbolSize: 5 //飞行线的宽度
},
animation : true,
lineStyle: {
normal: {
color: '#FFA535',
width: 1.6,
opacity: 0.5, //尾迹线条透明度
curveness: 0.3 //飞行线的弯曲程度
}
},
data: convertData(twoDatas)
},
{
name: '大流量',
type: 'lines',
effect: {
show: true, //启用飞行效果
period: 6, //飞行速度
symbol: "circle",
trailLength: 0.7, //飞行线的拖尾
color: '#FF745F', //飞行线的颜色
symbolSize: 5 //飞行线的宽度
},
animation : true,
lineStyle: {
normal: {
color: '#FF745F',
width: 1.6,
opacity: 0.5, //尾迹线条透明度
curveness: 0.3 //飞行线的弯曲程度
}
},
data: convertData(threeDatas)
},
// {
// name: '数据',
// type: 'effectScatter',
// coordinateSystem: 'geo',
// rippleEffect: {
// brushType: 'stroke'
// },
// label: {
// show: true,
// position: 'right',
// color: '#fff',
// formatter: '{b}'
// },
// symbolSize: function (val) {
// return val[2] / 1000;
// },
// itemStyle: {
// color: 'red'
// },
// data: data.map(function (dataItem) {
// // console.log("dataItem=======xxxxxx", dataItem)
// return {
// name: dataItem[1].name,
// value: geoCoordMap[dataItem[1].name].concat([dataItem[1].value])
// };
// })
// },
];
conf.legendIsShow ? series.push(...linesSeries) : ''; // 是否显示飞线
let option = {
backgroundColor: 'transparent',
grid: {
left: '3%',
right: '4%',
bottom: '0',
top: "0",
containLabel: true
},
tooltip: {
trigger: 'item',
backgroundColor: "rgba(122,150,237,.6)",
padding: [3, 6],
extraCssText: 'box-shadow: 2px 2px 10px rgba(21, 126, 245, 0.35);',
textStyle: {
color: '#000',
fontSize: 10,
},
formatter: function (params) {
if (params.value) {
return params.name + ' : ' + util.byteConvert(params.value);
} else {
return params.name;
}
}
},
geo: {
// 地理坐标系组件
map: "china",
geoIndex: 0,
roam: conf.roam ? conf.roam : false, // 可以缩放和平移
aspectScale:conf.aspectScale ? conf.aspectScale : 0.9, // 比例
layoutCenter: ["50%", "38%"], // position位置
layoutSize: conf.layoutSize ? conf.layoutSize : '120%', // 地图大小,保证了不超过 370x370 的区域
silent: true, // 禁止hover效果
center: conf.center ? conf.center : [105.194115019531, 36.582111640625],
label: {
// 图形上的文本标签
normal: {
show: false,
textStyle: {
color: "#E8E8E8",
fontSize: '8'
}
},
emphasis: { // 高亮时样式
color: "#333",
show: false
}
},
itemStyle: {
// 地图区域
normal: {
borderColor: conf.borderColor ? conf.borderColor : '#fff',
// areaColor: conf.areaColor ? conf.areaColor : "#DEE3F3",
areaColor: conf.areaColor ? conf.areaColor : "rgba(198,204,215,.65)",
// shadowOffsetX: 10,
shadowOffsetY: 10,
shadowColor:"rgba(198,204,215,.65)", // 省份边框阴影
// borderColor: `transparent`,
// borderWidth: 10,
// shadowBlur: 15, // 省份边框聚焦
// shadowColor: '#ccc',
// shadowBlur: 15,
// opacity:0.65
},
emphasis: {
color: '#DEE3F3' //悬浮背景
}
}
},
legend: conf.legendIsShow ? {
icon: "circle", // 字段控制形状 类型包括 circle,rect,line,roundRect,triangle,diamond,pin,arrow,none
itemWidth: 6, // 设置宽度
itemHeight: 6, // 设置高度
bottom: 12,
left: 106,
itemGap: conf.itemGap ? conf.itemGap : 26, // 设置间距
orient: "vertical", // vertical horizontal
textStyle: {
color: '#7A7A7A',
fontSize: 12
},
} : '',
visualMap: [{
type: "piecewise", //类型为分段型。
show: visualReset.show ? visualReset.show : true,
// show: false,
splitNumber: visualReset.splitNumber ? visualReset.splitNumber : 5, //对于连续型数据,自动平均切分成几段。默认为5段。 连续数据的范围需要 max 和 min 来指定。
pieces: visualReset.pieces ? visualReset.pieces : [{
min: 2000,
label: ">2000",
color: "#5D7FE2"
}, // 不指定 max,表示 max 为无限大(Infinity)。
{
min: 1500,
max: 2000,
label: "1500-2000",
color: "#7A96ED"
},
{
min: 1000,
max: 1500,
label: "1000-1500",
color: "#93ABF2"
},
{
min: 500,
max: 1000,
label: "500-1000",
color: "#BECAEC"
},
{
min: 0,
max: 500,
label: "0-500",
color: "#DEE3F3"
}
// {
// value: 0,
// label: "0"
// } // 不指定 min,表示 min 为无限大(-Infinity)。
],
inverse: false, // 图例排列顺序:从小到大
textStyle: {
width: 1,
color: '#7A7A7A',
fontSize: visualReset.fontSize ? 10 : visualReset.fontSize,
overflow: 'breakAll'
},
realtime: false,
calculable: false,
inRange: visualReset.inRange ? visualReset.inRange : {
color: ['#DEE3F3', '#BECAEC', '#93ABF2', '#7A96ED', '#5D7FE2']
},
orient: visualReset.orient ? visualReset.orient : "horizontal", // vertical horizontal
bottom: visualReset.bottom ? visualReset.bottom : 120,
left: visualReset.left ? visualReset.left : 10,
right: visualReset.right ? visualReset.right : 10,
itemWidth: 13,
itemHeight: 11,
textGap: 5,
itemSymbol: 'rect'
}],
series: series,
};
console.log("x------option====", option, series)
return option;
}
},
detached: function () {
clearInterval(this.data.timer)
},
})注意:小程序中兼容echarts版本不能高于5.0.0,会报错;依赖文件见下篇文章

