由于微服务架构中每个服务可能分散在不同的服务器上,因此需要一套分布式日志的解决方案。spring-cloud提供了一个用来trace服务的组件sleuth。它可以通过日志获得服务的依赖关系。基于sleuth,可以通过现有的日志工具实现分布式日志的采集。
这里使用的是ELK,也就是elasticsearch、logstash、kibana。
一、sleuth
第一步:sleuth管理端
sleuth一般单独放在一个工程中。需要添加如下依赖
        io.zipkin.java
        zipkin-autoconfigure-ui
        runtime


        io.zipkin.java
        zipkin-server
配置服务注册中心的地址
eureka:
  client:
    serviceUrl:
      defaultZone: http://localhost:1111/eureka/
启动类加入服务发现的注解和zipkin的注解,如下
package com.wlf.demo;

import org.springframework.boot.SpringApplication;
import org.springframework.boot.autoconfigure.SpringBootApplication;
import org.springframework.cloud.client.discovery.EnableDiscoveryClient;

import zipkin.server.EnableZipkinServer;

@EnableDiscoveryClient
@EnableZipkinServer
@SpringBootApplication
public class Application {

    public static void main(String[] args) {
        SpringApplication.run(Application.class, args);
    }

}
这个时候启动并访问该微服务的地址,可以看到zipkin的管理页面了。
推荐一个 Spring Boot 基础教程及实战示例:
https://github.com/javastacks...
第二步:被管理的微服务端
在我们的其他微服务端需要简单的配置,纳入到zipkin的管理之中
引入依赖
         org.springframework.cloud
         spring-cloud-starter-sleuth


         org.springframework.cloud
         spring-cloud-sleuth-zipkin
加入如下配置
spring:
  sleuth:
    sampler:
       percentage: 1
  zipkin:
base-url: http://localhost:9411spring.sleuth.sampler.percentage:这个参数的意思是抓取100%的日志,只有通过抓取日志,才能获知依赖关系。但是如果始终抓取日志的话对性能会有影响,因此可以自己配置。一般在开发环境,该值设置为1,生产环境视情况而定。
spring.zipkin.base-url:为第一步配置的zipkin管理端微服务的地址
现在分别启动服务注册中心,网关,需要的微服务,以及sleuth。
随便调用一个微服务

然后我们可以看到相关的跟踪日志

同样我们也可以看到微服务之间的依赖关系,这里是通过网关调用了myservice-consumer-feign微服务,然后通过myservice-consumer-feign微服务调用了myservice-provider微服务

二、搭建ELK
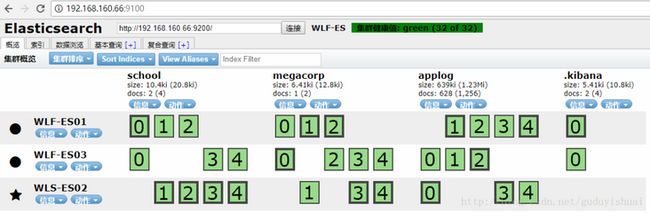
1、elasticsearch的安装与配置,由于之前的文章已经介绍了elasticsearch的单点,集群的安装,head插件的安装。这里不再总结。
2、kibana的安装,没什么好说的,解压,运行就可以了
3、logstash的安装,解压即可
在config下新建配置文件
output {
input {
  tcp {
      port => 4560
      codec => json_lines
  }
}

output {
  elasticsearch {
     hosts => ["192.168.160.66:9200","192.168.160.88:9200","192.168.160.166:9200"]
     index => "applog"
  }
}
其中port为端口号,codec表示通过json格式,elasticsearch.hosts表示elasticsearch的地址,这里是集群。index 为日志存储的elasticsearch索引。
启动需要调用bin下的logstash命令,通过-f指定配置文件
4、使用kibana
启动elasticsearch、head、kibana、logstash
创建索引applog
将applog配置到kibana中,在index pattern中输入我们的applog索引
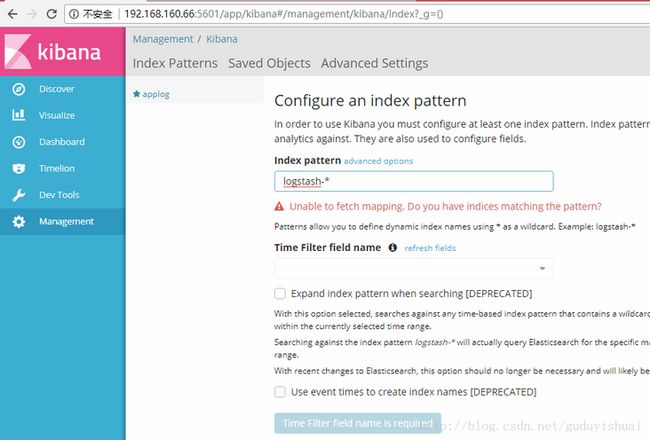

最后点击create即可
点击菜单中的discover即可查看日志

三、logback配置
spring-cloud、logstash都是支持logback的,因此需要为微服务配置好相应的logback-spring.xml
这里值得注意的是,在spring-boot中,logback-spring.xml的加载在application.yml之前。而我们需要在logback-spring.xml中使用spring.application.name。因此,我们需要把spring.application.name配置提到bootstrap.yml中。
加载顺序为bootstrap.yml,logback-spring.xml,application.yml
相比普通的logback-spring.xml,我们主要配置这几样东西spring.application.name,logstash的appender
这里提供一个logback-spring.xml的例子
     true

           ${CONSOLE_LOG_PATTERN}
     utf8


     192.168.160.66:4560


        UTC


         {
           "severity":"%level",
           "service": "${springAppName:-}",
                          "trace": "%X{X-B3-TraceId:-}",
                          "span": "%X{X-B3-SpanId:-}",
                          "exportable": "%X{X-Span-Export:-}",
                          "pid": "${PID:-}",
                          "thread": "%thread",
                          "class": "%logger{40}",
                          "rest": "%message"
         }


   main.log

     main.%d{yyyy-MM-dd}.log
     30


     %d{HH:mm:ss.SSS} [%thread] %-5level %logger{35} - %msg %n


     DEBUG
我们把message信息配置到了rest字段中。
三、查询日志
启动服务注册中心,网关,需要的微服务,以及sleuth。
启动elasticsearch,head,kibana,logstash,随便运行一个服务,比如
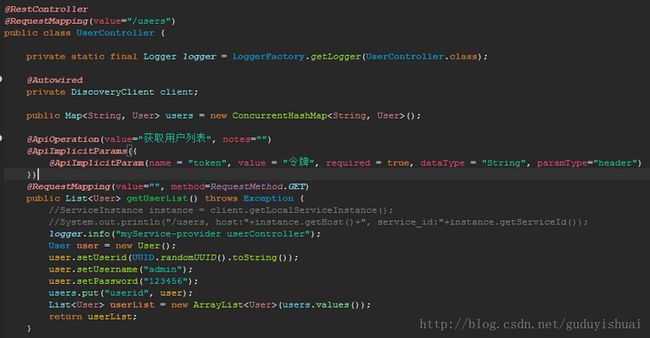
这里会输出一行日志,内容为myService-provider userController,通过网关调用

eclipse控制台输出日志
![]()
在kibana中搜索日志

我们看到日志信息在rest字段中。另外,通过trace和span还可以跟踪到整个微服务的调用过程。到此为止,整个日志采集就搭建完成了。
系统上线后只需要在elasticsearch中就能搜索到各个服务器上,各个微服务的日志内容了。
版权声明:本文为CSDN博主「guduyishuai」的原创文章,遵循CC 4.0 BY-SA版权协议,转载请附上原文出处链接及本声明。
原文链接:https://blog.csdn.net/guduyis...
近期热文推荐:
1.1,000+ 道 Java面试题及答案整理(2022最新版)
4.别再写满屏的爆爆爆炸类了,试试装饰器模式,这才是优雅的方式!!
觉得不错,别忘了随手点赞+转发哦!