防疫登记小程序
防疫登记小程序
看效果


代码
<!--index.wxml-->
<view class="page-wrapper">
<!-- 导航栏 -->
<view class="nav-title">
<view class="title-line"></view>
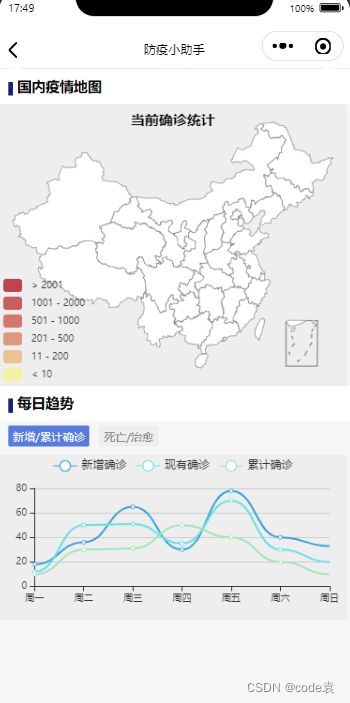
<view>国内疫情地图</view>
</view>
<!-- 这是地图 -->
<view class="container1">
<ec-canvas id="mychart-dom-area" canvas-id="mychart-area" ec="{{ ec }}"></ec-canvas>
</view>
<!-- 导航栏 -->
<view class="nav-title">
<view class="title-line"></view>
<view>每日趋势</view>
</view>
<view class="category">
<view class="{{lineSelected==index?'category-item-selected':'category-item'}}" wx:for-items="{{linegoryArr}}" bindtap="changeLine" wx:key="index" data-id="{{index}}">{{item}}</view>
</view>
<!-- 折线图1新增确诊和累计确诊 -->
<view class="container2" wx:if="{{lineSelected==0?true:false}}">
<ec-canvas id="mychart-dom-line1" canvas-id="mychart-line1" ec="{{ ec1 }}"></ec-canvas>
</view>
<!-- 折线图2累计治愈/死亡 -->
<view class="container2" wx:if="{{lineSelected==1?true:false}}">
<ec-canvas id="mychart-dom-area2" canvas-id="mychart-area2" ec="{{ ec2 }}"></ec-canvas>
</view>
</view>
import * as echarts from '../../ec-canvas/echarts';
import chinaJson from './chinaMap.js'
var mapData=[]
var city_url = "https://www.hkzhaoscut.top/normalUser/getCityData"
var province_url = "https://www.hkzhaoscut.top/normalUser/getProvinceData"
var gender_url = "https://www.hkzhaoscut.top/normalUser/getGenderData"
var age_url = "https://www.hkzhaoscut.top/normalUser/getAgeData"
var level_url = "https://www.hkzhaoscut.top/normalUser/getLevelData"
var util = require("../utils/chinaMap")
const app = getApp();
Page({

  data: {
    // 热力图
    ec: {
      onInit: initChart,
    },
    // 折线图1之累计确诊
    ec1: {
      onInit: initChart1,
    },
    // 折线图2之死亡治愈
    ec2: {
      onInit: initChart2,
    },
    linegoryArr: ["新增/累计确诊", "死亡/治愈"], //折线图的选择数组
    lineSelected: 0, //0表示第一个折线图,以此类推
    categoryArr: ["按省份", "按性别", "按年龄段"], //疫情数据的选择数组
    categorySelected: 0, //0表示按省份,以此类推
    displayData: [], //展示的数据
    dataDate: '', //数据日期
    headData:[],//头部的程度数据
    provincesData: [], //缓存一下省份数据,也就是切换时不会触发后台数据访问
    genderData: [], //性别数据,同上
    ageData: [], //年龄段数据,同上
  },
  // 更换显示的数据种类
  changeCategory(e) {
    var id = e.currentTarget.dataset.id;
    this.setData({
      categorySelected: id
    })
    if (id == 1) {
      this.getGender()
    } else if (id == 0) {
      this.getDetailData()
    } else if (id == 2) {
      this.getAge()
    }
  },
  // 更换显示的折线图
  changeLine(e) {
    var id = e.currentTarget.dataset.id;
    this.setData({
      lineSelected: id
    })
  },
  // 获取疫情数据
  getData() {

    this.getDetailData()
    this.getHeadData()
    this.getMapData()

  },

  // 获取疫情数据栏数据
  getDetailData() {
    var that = this
    if (that.data.provincesData.length != 0) {
      that.setData({
        displayData: that.data.provincesData
      })
    } else {
      wx.request({
        url: city_url,
        success(res) {
          // console.log(res)
          if (res.data.code == 200) {
            var formattedData = util.formatProvince(res.data.data)
            that.setData({
              displayData: formattedData,
              provincesData: formattedData
            })
          } else {
            wx.showToast({
              title: '数据获取失败',
              icon: 'none'
            })
          }

        }
      })
    }

  },
  // 获取性别信息
  getGender() {
    var that = this
    if (that.data.genderData.length != 0) {
      that.setData({
        displayData: that.data.genderData
      })
    } else {
      wx.request({
        url: gender_url,
        success(res) {
          console.log(res)
          if (res.data.code == 200) {
            var formattedData = util.formatGender(res.data.data)
            that.setData({
              displayData: formattedData,
              genderData: formattedData
            })
          } else {
            wx.showToast({
              title: '数据获取失败',
              icon: 'none'
            })
          }

        }
      })
    }

  },
  // 当前的头部数据
  getHeadData(){
    var that = this
    if (that.data.headData.length != 0) {
      that.setData({
        headData: that.data.headData
      })
    } else {
      wx.request({
        url: level_url,
        success(res) {
          console.log(res)
          if (res.data.code == 200) {
            console.log(res.data.data)
            var data = JSON.parse(JSON.stringify(res.data.data).replace(/人数/g, "num"))
            that.setData({
              headData: data
            })
          } else {
            wx.showToast({
              title: '数据获取失败',
              icon: 'none'
            })
          }

        }
      })
    }
  },
  // 热力图数据
  getMapData(){
    var that=this
    getMapData1().then(res=>{
      console.log(res)
      mapData=res
      setTimeout(function () {
        that.setData({
          ec: {
            onInit: initChart,
          }
        })
      }, 200) //延迟时间 这里是1秒

    })
  },
  // 获取年龄段信息
  getAge() {
    var that = this
    if (that.data.ageData.length != 0) {
      console.log("huancun")
      that.setData({
        displayData: that.data.ageData
      })
    } else {
      wx.request({
        url: age_url,
        success(res) {
          console.log(res)
          if (res.data.code == 200) {
            var formattedData = util.formatAge(res.data.data)
            that.setData({
              displayData: formattedData,
              ageData: formattedData
            })
          } else {
            wx.showToast({
              title: '数据获取失败',
              icon: 'none'
            })
          }

        }
      })
    }

  },

  onLoad() {
    this.getData()
    var date = new Date()
    this.setData({
      dataDate: util.formatTimeWithoutYear(date)
    })
  }

})
//生成地图的初始函数
function initChart(canvas, width, height) {
  const chart = echarts.init(canvas, null, {
    width: width,
    height: height
  });
  canvas.setChart(chart);

  echarts.registerMap('china', chinaJson);

  const option = {
    // 除地图外的背景颜色
    backgroundColor: "#eee",
    // title
    title: {
      text: '当前确诊统计',
      // subtext:"国内数据",
      left: 'center',
      top: '2%',
      textStyle: {
        color: 'black',
        fontWeight: "bold",
        fontSize: 15
      },
      // subtextStyle: {
      //   color: "grey",
      //   fontSize: 10
      // }

    },
    // visualMap
    visualMap: {
      type: 'piecewise',
      splitNumber: 5,
      pieces: [{
          min: 2001
        }, // 不指定 max,表示 max 为无限大(Infinity)。
        {
          min: 1001,
          max: 2000
        },
        {
          min: 501,
          max: 1000
        },
        {
          min: 201,
          max: 500
        },
        {
          min: 11,
          max: 200
        },
        {
          max: 10
        } // 不指定 min,表示 min 为无限大(-Infinity)。
      ],
      itemGap: 5,
      textStyle: {
        fontSize: 10,
        width: '70%'
      },
      left: 'left',
      top: 'bottom',
      calculable: true
    },
    // tooltip
    tooltip: {
      trigger: 'item',

    },
    //  toolbox,工具栏  可以设置保存地图等
    toolbox: {
      show: false,
      orient: 'vertical',
      left: 'right',
      top: 'center',
      feature: {
        dataView: {
          readOnly: false
        },
        restore: {},
        saveAsImage: {}
      }
    },
    series: [{
      type: 'map',
      mapType: 'china',
      zoom: 1.15,
      label: {
        // normal: {
        //   show: false,
        //   fontSize:10
        // },
        emphasis: {

          formatter: '{b}: {c}人',

          textStyle: {
            color: '#000',
            fontSize: 10,
          }
        },

      },
      itemStyle: {
        normal: {
          borderColor: '#615E5E',
          areaColor: 'white',
        },
        emphasis: {
          areaColor: '#1ABC9C',
          borderColor: '#1ABC9C',
          borderWidth: 0,
          // 真机体验不好
          // shadowColor: 'rgba(0, 0, 0, 0.5)',
          // shadowBlur: 10,
          opacity: 0.4
        }
      },
      animation: false,

      data: mapData

    }],

  };

  chart.setOption(option);

  return chart;
}
// 折线图1初始化
function initChart1(canvas, width, height) {
  const chart = echarts.init(canvas, null, {
    width: width,
    height: height
  });
  canvas.setChart(chart);

  var option = {
    backgroundColor: "#eee",
    color: ["#37A2DA", "#67E0E3", "#9FE6B8"],

    tooltip: {
      trigger: 'axis',
      show: true,
      axisPointer: {
        type: "line",

      },

    },
    legend: {

      data: ['新增确诊', '现有确诊', '累计确诊']
    },
    grid: {
      containLabel: true,
      top: '20%',
      left: '5%',
      right: "5%",
      bottom: "10%",
    },
    xAxis: {
      // 字体设置
      axisLabel: {
        fontSize: 10
      },
      axisPointer: {
        label: {
          show: true,
          margin: -50,
          formatter: function(params) {
            // 假设此轴的 type 为 'time'。
            console.log(params)
            return params.seriesData[0].seriesName + ' ' + params.seriesData[0].data + '\n' + params.seriesData[1].seriesName + ' ' + params.seriesData[1].data + '\n' + params.seriesData[2].seriesName + ' ' + params.seriesData[2].data

            ;
          },
          backgroundColor: "white",
          color: "#13227a"

        }
      },
      type: 'category',
      boundaryGap: false,
      data: ['周一', '周二', '周三', '周四', '周五', '周六', '周日']
    },
    yAxis: {
      axisLabel: {},
      axisPointer: {

      },
      minInterval: 1,
      x: 'center',
      type: 'value',
      // 字体设置
      axisLabel: {
        fontSize: 10
      },
    },
    series: [{
      name: '新增确诊',
      type: 'line',
      smooth: true,
      data: [18, 36, 65, 30, 78, 40, 33]
    }, {
      name: '现有确诊',
      type: 'line',
      smooth: true,
      data: [12, 50, 51, 35, 70, 30, 20]
    }, {
      name: '累计确诊',
      type: 'line',
      smooth: true,
      data: [10, 30, 31, 50, 40, 20, 10]
    }, ]
  };

  chart.setOption(option);
  return chart;
}
// 折线图2初始化
function initChart2(canvas, width, height) {
  const chart = echarts.init(canvas, null, {
    width: width,
    height: height
  });
  canvas.setChart(chart);

  var option = {
    backgroundColor: "#eee",
    color: ["#37A2DA", "#67E0E3", "#9FE6B8"],

    tooltip: {
      trigger: 'axis',
      show: true,
      axisPointer: {
        type: "line",

      },

    },
    legend: {

      data: ['死亡', '治愈']
    },
    grid: {
      containLabel: true,
      top: '20%',
      left: '5%',
      right: "5%",
      bottom: "10%",
    },
    xAxis: {
      // 字体设置
      axisLabel: {
        fontSize: 10
      },
      axisPointer: {
        label: {
          show: true,
          margin: -50,
          formatter: function(params) {
            // 假设此轴的 type 为 'time'。
            console.log(params)
            return params.seriesData[0].seriesName + ' ' + params.seriesData[0].data + '\n' + params.seriesData[1].seriesName + ' ' + params.seriesData[1].data

            ;
          },
          backgroundColor: "white",
          color: "#13227a"

        }
      },
      type: 'category',
      boundaryGap: false,
      data: ['周一', '周二', '周三', '周四', '周五', '周六', '周日']
    },
    yAxis: {
      axisLabel: {},
      axisPointer: {

      },
      minInterval: 1,
      x: 'center',
      type: 'value',
      // 字体设置
      axisLabel: {
        fontSize: 10
      },
    },
    series: [{
      name: '死亡',
      type: 'line',
      smooth: true,
      data: [18, 36, 65, 30, 78, 40, 33]
    }, {
      name: '治愈',
      type: 'line',
      smooth: true,
      data: [12, 50, 51, 35, 70, 30, 20]
    }, ]
  };

  chart.setOption(option);
  return chart;
}


// 获取疫情热力地图数据
function getMapData1() {
  return new Promise(function(reslove,rejected){
    wx.request({
      url: province_url,
      success(res) {
        console.log(res)
        if (res.data.code == 200) {
          reslove(util.formatMap(res.data.data))
        } else {
          wx.showToast({
            title: '数据获取失败',
            icon: 'none'
          })
        }

      }
    })
  })

};
总结
记得点赞哦