机器学习实战笔记
文章目录
- 2 k近邻算法
-
- 2.1 实施kNN算法
-
- 代码清单1:
- 测试,结果:
- 2.2使用kNN改进约会网站的配对效果
-
- 2.2.1 准备数据,从文本中解析数据
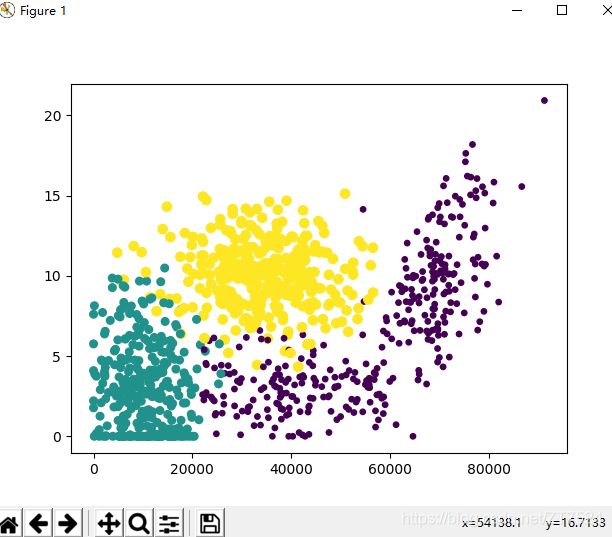
- 2.2.2 分析数据: 使用Matplotlib创建散点图
- 2.2.3 准备数据:归一化数值
- 测试算法:作为完整程序验证
- 2.3使用算法:构建完整可用系统
-
- 2.3.1 准备数据:将图像转换为测试向量
- 2.3.2 测试算法:使用kNN近邻算法识别手写数字
- 3 决策树
-
- 3.1 决策树构造
-
- 3.1.1信息增益
- 3.1.2 划分数据集
- 3.1.3 递归构建决策树
- 3.3 测试和存储分类器
-
- 3.3.1 测试算法:使用决策树执行分类
- 3.3.2 决策树存储
- 3.4 示例:使用决策树预测隐形眼镜类型
- 3 朴素贝叶斯 & 4 Logistic回归
2 k近邻算法
2.1 实施kNN算法
代码清单1:
'''
Author: Solarzhou
Email: [email protected]
'''
from numpy import *
import operator
def createDataSet():
     group = array([[1.0,1.1],[1.0,1.0],[0,0],[0,0.1]])
     labels = ['A', 'A', 'B', 'B']
     return group, labels
def classify0(inX, dataSet, labels, k):
    #获取数据集维度,集有多少个向量
    dataSetSize = dataSet.shape[0]
    diffMat = tile(inX, (dataSetSize,1)) - dataSet
    sqDiffMat = diffMat ** 2
    # 对应的每一行相加
    sqDistances = sqDiffMat.sum(axis=1)
    distances = sqDistances**0.5

    # 先按由小到大排列,在获取原来数组中对应的索引号
    # 这里数值最小的就是关系最紧密的
    sortedDistIndicies = distances.argsort()
    classCount = {}
    for i in range(k):
        voteIlabel = labels[sortedDistIndicies[i]]
        classCount[voteIlabel] = classCount.get(voteIlabel,0) + 1
    # sorted() 排序函数,这里采用降序;
    # 其中第二个参数key表示,通过第一个参数获取的键值对中的值进行排序
    sortedClassCount = sorted(classCount.items(),
                              key=operator.itemgetter(1), reverse=True)
    print(sortedClassCount)
    return sortedClassCount[0][0]
测试,结果:
from LearningSpark import KNN
group, labels = KNN.createDataSet()
KNN.classify0([0, 0], group, labels, 3)
[('B', 2), ('A', 1)]
'B'
KNN.classify0([1, 1], group, labels, 3)
[('A', 2), ('B', 1)]
'A'
2.2使用kNN改进约会网站的配对效果
2.2.1 准备数据,从文本中解析数据
# 将文本记录转换为NumPy的解析程序
def file2matrix(filename):
    fr = open(filename)
    numberOfLines = len(fr.readlines())         #get the number of lines in the file
    returnMat = zeros((numberOfLines,3))        #prepare matrix to return
    classLabelVector = []                       #prepare labels return
    fr = open(filename)
    index = 0
    for line in fr.readlines():
        line = line.strip()
        listFromLine = line.split('\t')
        returnMat[index,:] = listFromLine[0:3]
        transfomation = listFromLine[-2]

        classLabelVector.append(int(listFromLine[-1]))
        index += 1
    return returnMat,classLabelVector
- 测试结果
注意:书中的源码在这里有出错误。
1)在读取文本文件时,应该是datingTestSet2.txt,否则会报错:
int() invalid literal for int() with base 10: ''
importlib.reload(KNN)
<module 'LearningSpark.KNN' from 'E:\\Users\\Administrator\\PycharmProjects\\TestCases\\LearningSpark\\KNN.py'>
datingDataMat, datingLabels = KNN.file2matrix('LearningSpark/Ch02/datingTestSet2.txt')
datingDataMat
array([[4.0920000e+04, 8.3269760e+00, 9.5395200e-01],
       [1.4488000e+04, 7.1534690e+00, 1.6739040e+00],
       [2.6052000e+04, 1.4418710e+00, 8.0512400e-01],
       ...,
       [2.6575000e+04, 1.0650102e+01, 8.6662700e-01],
       [4.8111000e+04, 9.1345280e+00, 7.2804500e-01],
       [4.3757000e+04, 7.8826010e+00, 1.3324460e+00]])
datingLabels[0:20]
[3, 2, 1, 1, 1, 1, 3, 3, 1, 3, 1, 1, 2, 1, 1, 1, 1, 1, 2, 3]
2.2.2 分析数据: 使用Matplotlib创建散点图
- 使用
Matplotlib制作原始数据的散点图
import matplotlib.pyplot as plt
fig = plt.figure()
ax = fig.add_subplot(111)
ax.scatter(datingDataMat[:,1], datingDataMat[:,2])
<matplotlib.collections.PathCollection object at 0x00000245657F1C88>
plt.show()
- 利用
datingLabels中的类标签属性,在散点图上绘制色彩不等的点
ax.scatter(datingDataMat[:,0], datingDataMat[:,1],
           15.0*np.array(datingLabels), 15.0*np.array(datingLabels))
<matplotlib.collections.PathCollection object at 0x000002456E563EB8>
plt.show()
2.2.3 准备数据:归一化数值
归一化特征值
# 归一化特征值
def autoNorm(dataSet):
    minVals = dataSet.min(0) # min得到的每一列中的最小值
    maxVals = dataSet.max(0)
    ranges = maxVals - minVals
    normDataSet = zeros(shape(dataSet))
    m = dataSet.shape[0]
    normDataSet = dataSet - tile(minVals, (m, 1))
    normDataSet = normDataSet/tile(ranges, (m, 1))
    return normDataSet, ranges, minVals
运行测试:
normMat, ranges, minVals = KNN.autoNorm(datingDataMat)
normMat
array([[0.44832535, 0.39805139, 0.56233353],
       [0.15873259, 0.34195467, 0.98724416],
       [0.28542943, 0.06892523, 0.47449629],
       ...,
       [0.29115949, 0.50910294, 0.51079493],
       [0.52711097, 0.43665451, 0.4290048 ],
       [0.47940793, 0.3768091 , 0.78571804]])
ranges
array([9.1273000e+04, 2.0919349e+01, 1.6943610e+00])
len(ranges)
3
测试算法:作为完整程序验证
分类器分类器针对约会网站的测试代码
# 测试代码
def datingClassTest():
    hoRatio =0.10
    datingDataMat, datingLables = file2matrix('LearningSpark/Ch02/datingTestSet2.txt')
    normMat, ranges, minVals = autoNorm(datingDataMat)
    m = normMat.shape[0]
    # 训练集的向量数
    numTestVecs = int(m * hoRatio)
    errorCount = 0.0
    for i in range(numTestVecs):
        classifierResult = classify0(normMat[i,:], normMat[numTestVecs:m,:],
                                     datingLables[numTestVecs:m], 5)
        print("the classifier come back with: %d, the real answer is: %d"
              %(classifierResult, datingLables[i]))
        if (classifierResult != datingLables[i]):
            errorCount += 1.0

    print('the total error rate is:%f'%(errorCount/float(numTestVecs)))
2.3使用算法:构建完整可用系统
2.3.1 准备数据:将图像转换为测试向量
将图像转换为测试向量
# 手写识别系统
# 将图像转换为测试向量
def img2vector(filename):
    returnVect = zeros((1,1024))
    fr = open(filename)
    for i in range(32):
        lineStr = fr.readline()
        for j in range(32):
            returnVect[0,32*i+j] = int(lineStr[j])
    return returnVect
测试结果:
testVector = KNN.img2vector('LearningSpark/Ch02/digits/testDigits/0_13.txt')
testVector[0,0:31]
array([0., 0., 0., 0., 0., 0., 0., 0., 0., 0., 0., 0., 0., 0., 1., 1., 1.,
       1., 0., 0., 0., 0., 0., 0., 0., 0., 0., 0., 0., 0., 0.])
2.3.2 测试算法:使用kNN近邻算法识别手写数字
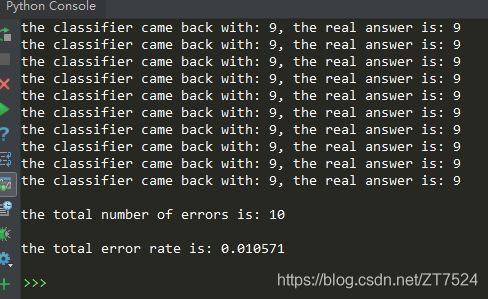
手写数字识别系统的测试代码。
首先需要导入listdir,读取文件目录;因此我们首先要确保from os import listdir写入文件的其实部分。
# 手写数字识别系统的测试代码
def handwritingClassTest():
    hwLabels = []
    trainingFileList = listdir('LearningSpark/Ch02/digits/trainingDigits')           #load the training set
    m = len(trainingFileList)
    trainingMat = zeros((m,1024))
    for i in range(m):
        fileNameStr = trainingFileList[i]
        fileStr = fileNameStr.split('.')[0]     #take off .txt
        classNumStr = int(fileStr.split('_')[0])
        hwLabels.append(classNumStr)
        trainingMat[i,:] = img2vector('LearningSpark/Ch02/digits/trainingDigits/%s' % fileNameStr)
    testFileList = listdir('LearningSpark/Ch02/digits/testDigits')        #iterate through the test set
    errorCount = 0.0
    mTest = len(testFileList)
    for i in range(mTest):
        fileNameStr = testFileList[i]
        fileStr = fileNameStr.split('.')[0]     #take off .txt
        classNumStr = int(fileStr.split('_')[0])
        vectorUnderTest = img2vector('LearningSpark/Ch02/digits/testDigits/%s' % fileNameStr)
        classifierResult = classify0(vectorUnderTest, trainingMat, hwLabels, 3)
        print("the classifier came back with: %d, the real answer is: %d" % (classifierResult, classNumStr))
        if (classifierResult != classNumStr): errorCount += 1.0
    print("\nthe total number of errors is: %d" % errorCount)
    print("\nthe total error rate is: %f" % (errorCount/float(mTest)))
3 决策树
3.1 决策树构造
首先我们需要理解 信息熵, 条件信息熵,信息增益。
信息熵是代表随机变量的复杂度(不确定性);
条件熵代表在某一个条件下,随机变量的复杂度(不确定度);
信息增益: 信息熵-条件熵。也就是说,信息增益代表了在一个条件下,信息复杂度(不确定性)减少程度。
参考文档–知乎专栏
3.1.1信息增益
在划分数据集之前之后信息发生的变化成为信息增益。
计算给定数据集的香农熵。
# 香农熵
def calcShannonEnt(dataset):
    numEntries = len(dataset)
    labelCounts = {}
    for feaVec in dataset:
        currentLabel = feaVec[-1]
        if currentLabel not in labelCounts.keys():
            labelCounts[currentLabel] = 0
        labelCounts[currentLabel] += 1
    shannonEnt = 0.0
    for key in labelCounts:
        prob = float(labelCounts[key]/numEntries)
        shannonEnt -= prob * log(prob, 2)
    return shannonEnt
创建自己的数据集
# 创建自己的数据集
def createDataSet():
    dataSet = [[1, 1, 'yes'],
               [1, 1, 'yes'],
               [1, 0, 'no'],
               [0, 1, 'no'],
               [0, 1, 'no']]
    labels = ['no surfacing', 'flippers']
    return dataSet, labels
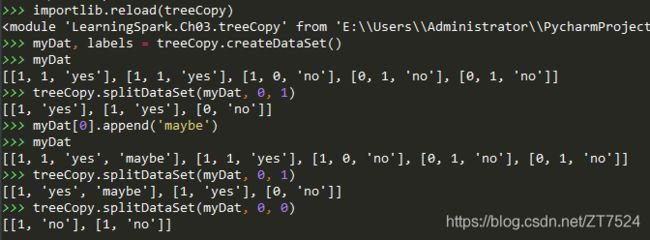
测试结果:
myDat, labels = treeCopy.createDataSet()
myDat
[[1, 1, 'yes'], [1, 1, 'yes'], [1, 0, 'no'], [0, 1, 'no'], [0, 1, 'no']]
treeCopy.calcShannonEnt(myDat)
0.9709505944546686
myDat[0][-1] = 'maybe'
myDat
[[1, 1, 'maybe'], [1, 1, 'yes'], [1, 0, 'no'], [0, 1, 'no'], [0, 1, 'no']]
treeCopy.calcShannonEnt(myDat)
1.3709505944546687
可以看到分类越多,信息熵越大;信息熵天生偏向选择分支多的属性。
3.1.2 划分数据集
- 按照给定的特征划分数据集
def splitDataSet(dataSet, axis, value):
    '''
    :param dataSet: 带划分的数据集
    :param axis: 划分数据集的特征
    :param value: 需要返回的特制的值
    也即,获取某一特征的其余值
    :return:
    '''
    retDataSet = []
    for featVec in dataSet:
        if featVec[axis] == value:
            reducedFeatVec = featVec[:axis]
            reducedFeatVec.extend(featVec[axis+1:])
            retDataSet.append(reducedFeatVec)
    return retDataSet
- 选择最好的数据集划分方式
#选择组好的数据集划分方式
def chooseBestReatureToSplit(dataSet):
    numFeatures = len(dataSet[0])-1
    baseEntroy = calcShannonEnt(dataSet)
    print('baseEntroy:',baseEntroy)
    bestInfoGain = 0.0; bestFeature = -1
    for i in range(numFeatures):
        featList = [example[i] for example in dataSet]
        uniqueVals = set(featList)
        newEntroy = 0.0
        for value in uniqueVals:
            subDataSet = splitDataSet(dataSet, i, value)
            prop = len(subDataSet)/float(len(dataSet))
           # 这里是在算条件熵
            newEntroy += prop * calcShannonEnt(subDataSet)
            print("newEntroy:", newEntroy)
        infoGain = baseEntroy - newEntroy
        print('infoGain:', infoGain)
        if (infoGain > bestInfoGain):
            bestInfoGain = infoGain
            bestFeature = i
    return bestFeature
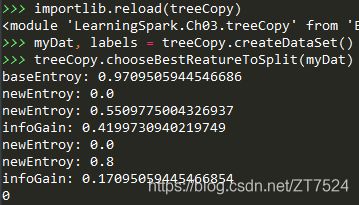
这里我们将 baseEntroy, newEntroy, infoGain打印出来,便于查看测试结果:
3.1.3 递归构建决策树
递归调用时非常复杂,要想想明白挺不容易。
之前看过一本外国人写的 Python书籍,提到递归这一块,给的建议是:相信你写的是正确的,那就是正确的。
# 创建树
def createTree(dataSet, labels):
    classList = [example[-1] for example in dataSet]
    if classList.count(classList[0]) == len(classList):
        return classList[0]
    if len(dataSet[0]) == 1:
        return majorityCnt(classList)
    bestFeat = chooseBestReatureToSplit(dataSet)
    bestFeatLabel = labels[bestFeat]
    myTree = {bestFeatLabel: {}}
    del(labels[bestFeat])
    bestValues = [example[bestFeat] for example in dataSet]
    uniqueVals = set(bestValues)
    for value in uniqueVals:
        subLables = labels[:]

        myTree[bestFeatLabel][value] = createTree(splitDataSet\
                        (dataSet, bestFeat, value), subLables)
    return myTree
3.3 测试和存储分类器
3.3.1 测试算法:使用决策树执行分类
构建决策树分类函数
# 使用决策树的分类函数
def classify(inputTree, featLabels, testVec):
    firstStr = list(inputTree.keys())[0]
    secondDict = inputTree[firstStr]
    featIndex = featLabels.index(firstStr)
    for key in secondDict.keys():
        if testVec[featIndex] == key:
            if type(secondDict[key]).__name__=='dict':
                classLable = classify(secondDict[key], featLabels, testVec)
            else: classLable = secondDict[key]
    return classLable
测试结果:
myDat, labels = treeCopy.createDataSet()
labels
['no surfacing', 'flippers']
myTree = treePlotterCopy.retrieveTree(0)
myTree
{'no surfacing': {0: 'no', 1: {'flippers': {0: 'no', 1: 'yes'}}}}
treeCopy.classify(myTree, labels, [1, 0])
'no'
treeCopy.classify(myTree, labels, [1, 1])
'yes'
3.3.2 决策树存储
# 使用 pickle 模块存储决策树
def storeTree(inputTree, filename):
    import pickle
    fw = open(filename, 'wb+')
    pickle.dump(inputTree, fw, 0)
    fw.close()
def grabTree(filename):
    import pickle
    fr = open(filename, 'rb')
    readTree = pickle.load(fr)
    return readTree
**注意:**按书中的方式写入文件会报错,我们这里指定格式为:fw = open(filename, 'wb+')
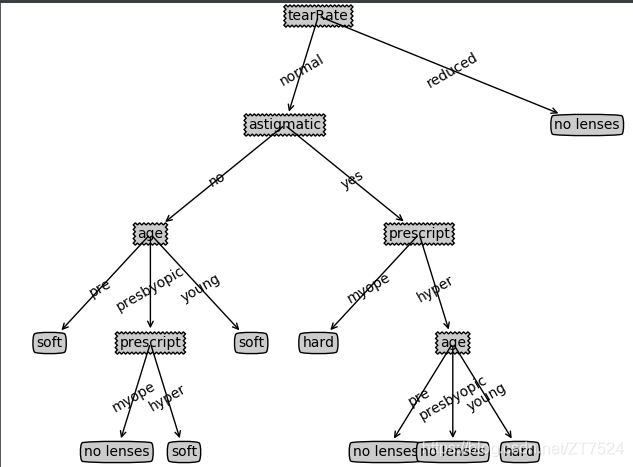
3.4 示例:使用决策树预测隐形眼镜类型
    fr = open('LearningSpark/Ch03/lenses.txt')
    lenses = [inst.strip().split('\t') for inst in fr.readlines()]
    len(lenses)
    24
    lenses
    [['young', 'myope', 'no', 'reduced', 'no lenses'], ['young', 'myope', 'no', 'normal', 'soft'], ['young', 'myope', 'yes', 'reduced', 'no lenses'], ['young', 'myope', 'yes', 'normal', 'hard'], ['young', 'hyper', 'no', 'reduced', 'no lenses'], ['young', 'hyper', 'no', 'normal', 'soft'], ['young', 'hyper', 'yes', 'reduced', 'no lenses'], ['young', 'hyper', 'yes', 'normal', 'hard'], ['pre', 'myope', 'no', 'reduced', 'no lenses'], ['pre', 'myope', 'no', 'normal', 'soft'], ['pre', 'myope', 'yes', 'reduced', 'no lenses'], ['pre', 'myope', 'yes', 'normal', 'hard'], ['pre', 'hyper', 'no', 'reduced', 'no lenses'], ['pre', 'hyper', 'no', 'normal', 'soft'], ['pre', 'hyper', 'yes', 'reduced', 'no lenses'], ['pre', 'hyper', 'yes', 'normal', 'no lenses'], ['presbyopic', 'myope', 'no', 'reduced', 'no lenses'], ['presbyopic', 'myope', 'no', 'normal', 'no lenses'], ['presbyopic', 'myope', 'yes', 'reduced', 'no lenses'], ['presbyopic', 'myope', 'yes', 'normal', 'hard'], ['presbyopic', 'hyper', 'no', 'reduced', 'no lenses'], ['presbyopic', 'hyper', 'no', 'normal', 'soft'], ['presbyopic', 'hyper', 'yes', 'reduced', 'no lenses'], ['presbyopic', 'hyper', 'yes', 'normal', 'no lenses']]
    lensesLabels = ['age', 'prescript', 'astigmatic', 'tearRate']
    lensesTree = treeCopy.createTree(lenses, lensesLabels)
    lensesTree
    {'tearRate': {'normal': {'astigmatic': {'no': {'age': {'pre': 'soft', 'presbyopic': {'prescript': {'myope': 'no lenses', 'hyper': 'soft'}}, 'young': 'soft'}}, 'yes': {'prescript': {'myope': 'hard', 'hyper': {'age': {'pre': 'no lenses', 'presbyopic': 'no lenses', 'young': 'hard'}}}}}}, 'reduced': 'no lenses'}}
    treePlotterCopy.createPlot(lensesTree)
3 朴素贝叶斯 & 4 Logistic回归
机器学习实战–朴素贝叶斯 & 4 Logistic回归
