收益率曲线(Yield Curve)是显示一组货币和信贷风险均相同,但期限不同的债券或其他金融工具收益率的图表。纵轴代表收益率,横轴则是距离到期的时间。在此用python建模分析零息票收益率曲线,输出图表并制图。
首先要理解收益率的计算方法,然后计算出连续复利和复利。再根据计算步骤在python中编写代码建模
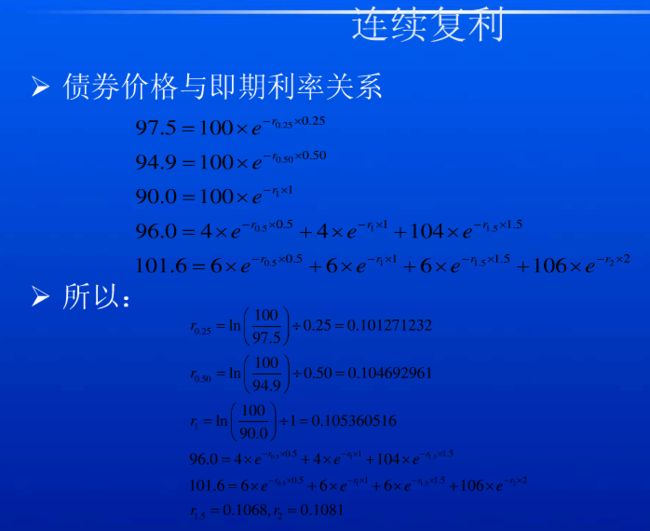
此为连续复利的计算

1 # 没有年息票的一年期以内的零息票年收益率YTM=(log(面值/价格))/期限
2 r1 = np.log(100/97.5)/0.25
3 r2 = np.log(100/94.9)/0.5
4 r3 = np.log(100/90)/1
5 print('第0.25年年息票收益率:',round(r1,5))
6 print('第0.5年年息票收益率:',round(r2,5))
7 print('第1年年息票收益率:',round(r3,5))
 1 #每半年付息一次的有年息票的零息票年收益率YTM:零息票年收益率=[log((年息票/2+面值)/(债券价格-年息票/2*(前期价格/面值)))]/期限
 2 #价格=(年息票/2)*e^(-r2*0.5)+(年息票/2)*e^(-r3*1)+(年息票/2+面值)*e^(-r4*1.5)
 3 # r4=[log(104/(94-(94.9+90)/100)]/1.5
 4 #超过一年期的零息票年收益率YTM=(面值/价格)开期限n的次方根减1
 5 rate2 = math.pow(100 / 84.99, float(1) / float(3))-1
 6 print(rate2)
 7 # 96=4*(1+0.5*r2)^-1+4*(1+r3)^-1+104*(1+r4)^-1.5
 8 r4 = np.log(104/88.604)/1.5
 9 print('第1.5年年息票收益率:',round(r4,5))
10
11 r5 = np.log(106/(101.6-(1.849*6+88.604/104*6)))/2#np.log(106/85.394)/2
12 print('第2年年息票收益率:',round(r5,5))
 1 #线性插值
 2 #第0.75年年息票收益率:
 3 r6 = (r2+r3)/2
 4 print('第0.75年年息票收益率:',round(r6,5))
 5 #第1.25年年息票收益率:
 6 r7 = (r3+r4)/2
 7 print('第1.25年年息票收益率:',round(r7,5))
 8 #第1.75年年息票收益率:
 9 r8 = (r4+r5)/2
10 print('第1.75年年息票收益率:',round(r8,5))
11 #第2.25年年息票收益率:
12 # r9 = 2(r5)/3 +(r'第2.75年年息票收益率')/3
13 # print('第2.25年年息票收益率:',round(r9,5))

1.我们需要在python中加载相应的模块来进行开发调式
1 import pandas as pd
2 import numpy as np
3 import matplotlib.pyplot as plt
4 import math
5 import os
6 import operator
7 import sys#实现从程序外部向程序传递参数。
8 import xlrd
2.确定输入及输出的文件路径,读取文件
1 InputPath=sys.argv[1]#输入路径
2 OutputPath=sys.argv[2]#输出路径
3 filePath = InputPath#处理的文件为在输入路径中读取的文件
3.明确表中的字段,定义两个空字典输出计算的数值

上表为输入表,根据表中的字段来计算收益率,Period为付息频率,我们需要取CouponFrequency中的最大值来进行计算
1 df = pd.read_excel(filePath)
2 bondsCount = df.shape[0]
3
4 dicE4Calc = {}#定义一个空的价格比计算表。价格/面值
5 dicResult = {}#定义一个空的结果表
6
7 Period = 1 / df['CouponFrequency'].max()#步长为0.5
4.定义一个价格合计,根据这个合计来进行迭代计算
1 def getPreSum(pCoupon, targetTerm, startTerm):#前期价格合计
2     sum = 0
3     p = startTerm
4     while (p < targetTerm):#要小于目标的期限
5         sum += dicE4Calc[str(p)] * pCoupon
6         p += Period#期限以0.5递增
7
8     return sum#返回的是新计算出来的价格
5.定义线性插值法计算,利用前后两期数据可以求出中间的值
 1 def LinearInterpolation(pCoupon, targetTerm, interval):#线性插值法利用中位数求利率
 2     sum = 0
 3     p = interval
 4     while p < targetTerm:
 5         if str(p) not in dicResult:#结果表中没有的数据,left为前面一期,right为后面一期
 6             r_Left = str(p - interval)
 7             r_Right = str(p + interval)
 8
 9             if r_Left in dicResult and r_Right in dicResult:#结果表中有前后的数据就用插值法计算
10                 r = (dicResult[r_Left] + dicResult[r_Right]) / 2
11
12             elif r_Left in dicResult and r_Right not in dicResult:#有前面的数据没有后面的数据
13                 r_Left2 = str(p - interval - interval)#left为前2期
14                 r = dicResult[r_Left2] + (dicResult[r_Left] - dicResult[r_Left2]) / (interval) * (p - float(r_Left2))
15
16
17             dicResult[str(p)] = r
18             dicE4Calc[str(p)] = pow(math.e, -r * p)#e的(-r*p)次方
19
20         p += interval
6.读取表格
df['Coupon']=df['Coupon'].fillna(0)#若Coupon为空值则填充为0
for i in range(bondsCount):#读取表格中对应的列

    FaceValue = df.loc[i, 'FaceValue']
    Price = df.loc[i, 'Price']
    Term = df.loc[i, 'Term_Y']
    Coupon = df.loc[i, 'Coupon']
    CouponFrequency = df.loc[i, 'CouponFrequency']
    YTM = 0
    e4Calc = 0
7.计算有年息和无年息的收益率
 1  if Coupon == 0:
 2
 3         e4Calc = Price / FaceValue
 4
 5         YTM = math.log(FaceValue / Price) / Term
 6
 7     else:#有息票的计算
 8         PeriodCoupon = Coupon * Period#年息票的0.5
 9
10
11         if Term % Period == 0:#从0.5年开始
12             LinearInterpolation(PeriodCoupon, Term, Period)
13             e4Calc = (Price - getPreSum(PeriodCoupon, Term, Period)) / (FaceValue + PeriodCoupon)
14
15         else:#不是从0.5开始,需要在起始日期以0.5年递增
16             LinearInterpolation(PeriodCoupon, Term, Term % Period)
17             e4Calc = (Price - getPreSum(PeriodCoupon, Term, Term % Period)) / (FaceValue + PeriodCoupon)
18
19         YTM = math.log(1 / e4Calc) / Term
20
21     dicE4Calc[str(Term)] = e4Calc
22     dicResult[str(Term)] = round(YTM, 9)
8.把计算结果写到输出表中
 1 sorted_dicResult = sorted(dicResult.items(),key =operator.itemgetter(0))#把求出的收益率按期限排序,把字典转为列表
 2 # print(dicResult)
 3 print(sorted_dicResult)
 4 Term = [i[0] for i in sorted_dicResult ]#遍历列表中的期限
 5 Yield = [i[1] for i in sorted_dicResult ]#遍历列表中的
 6 data={"Term":Term,"Yield":Yield}
 7 columns=['Term','Yield']
 8 df=pd.DataFrame(data=data,columns=columns)
 9 df['TermBase']='Y'
10 df = df.set_index("TermBase")
11 df.to_excel(OutputPath,sheet_name='OutPut')
12
13 print(df)
9.绘制出收益率曲线图
1 x = Term
2 y = Yield
3 plt.plot(x,y)
4 plt.xlabel('CouponFrequency')#期限
5 plt.ylabel('YTM')#收益率
6 plt.title('Zero coupon yield curve')#命名
7 plt.show()
最终结果如下:

复利的计算也类似,完整代码如下:

  1 #复利计算
  2 import pandas as pd
  3 import numpy as np
  4 import matplotlib.pyplot as plt
  5 import math
  6 import os
  7 import operator
  8 import sys
  9 import xlrd
 10 from openpyxl import Workbook
 11 from openpyxl import load_workbook
 12 from openpyxl.utils import get_column_letter
 13 from openpyxl.compat import range
 14
 15 InputPath=sys.argv[1]
 16 OutputPath=sys.argv[2]
 17 print(InputPath)
 18 print(OutputPath)
 19
 20 filePath = InputPath
 21 df = pd.read_excel(filePath)
 22 bondsCount = df.shape[0]
 23 dicE4Calc = {}
 24 dicResult = {}
 25 Period = 0.5
 26
 27 def getPreSum(pCoupon, targetTerm, startTerm):
 28     sum = 0
 29     p = startTerm
 30     while (p < targetTerm):
 31         sum += dicE4Calc[str(p)] * pCoupon
 32         p += Period
 33
 34     return sum
 35
 36 def LinearInterpolation(pCoupon, targetTerm, interval):
 37     sum = 0
 38     p = interval
 39     while p < targetTerm:
 40         if str(p) not in dicResult:
 41             r_Left = str(p - interval)
 42             r_Right = str(p + interval)
 43
 44             if r_Left in dicResult and r_Right in dicResult:
 45                 r = (dicResult[r_Left] + dicResult[r_Right]) / 2
 46
 47             elif r_Left in dicResult and r_Right not in dicResult:
 48                 r_Left2 = str(p - interval - interval)
 49                 r = dicResult[r_Left2] + (dicResult[r_Left] - dicResult[r_Left2]) / (interval) * (p - float(r_Left2))
 50
 51             dicResult[str(p)] = r
 52             dicE4Calc[str(p)] = pow(math.e, -r * p)
 53
 54         p += interval
 55 Period = 1 / df['CouponFrequency'].max()
 56 df['Coupon']=df['Coupon'].fillna(0)
 57 for i in range(bondsCount):
 58
 59     FaceValue = df.loc[i, 'FaceValue']
 60     Price = df.loc[i, 'Price']
 61     Term = df.loc[i, 'Term_Y']
 62     Coupon = df.loc[i, 'Coupon']
 63     CouponFrequency = df.loc[i, 'CouponFrequency']
 64     YTM = 0
 65     e4Calc = 0
 66
 67     if Coupon == 0:
 68
 69         e4Calc = Price / FaceValue
 70
 71         YTM = pow(FaceValue / Price,1/ Term) -1
 72
 73     else:
 74         PeriodCoupon = Coupon * Period
 75
 76         if Term % Period == 0:
 77             LinearInterpolation(PeriodCoupon, Term, Period)
 78
 79             e4Calc = (Price - getPreSum(PeriodCoupon, Term, Period)) / (FaceValue + PeriodCoupon)
 80
 81         else:
 82
 83             LinearInterpolation(PeriodCoupon, Term, Term % Period)
 84             e4Calc = (Price - getPreSum(PeriodCoupon, Term, Term % Period)) / (FaceValue + PeriodCoupon)
 85
 86         YTM = pow(1 / e4Calc,1/ Term) - 1
 87
 88     dicE4Calc[str(Term)] = e4Calc
 89     dicResult[str(Term)] = round(YTM, 9)
 90
 91 # print(dicE4Calc)
 92 # print(dicResult)
 93
 94 sorted_dicResult = sorted(dicResult.items(),key =operator.itemgetter(0))
 95 # print(dicResult)
 96 print(sorted_dicResult)
 97 Term = [i[0] for i in sorted_dicResult ]
 98 Yield = [i[1] for i in sorted_dicResult ]
 99
100 data={"Term":Term,"Yield":Yield}
101 columns=['Term','Yield']
102 df=pd.DataFrame(data=data,columns=columns)
103 df['TermBase']='Y'
104 df = df.set_index("TermBase")
105 df.to_excel(OutputPath,sheet_name='OutPut')
106 print(df)
107
108 x = Term
109 y = Yield
110 plt.plot(x,y)
111 plt.xlabel('CouponFrequency')
112 plt.ylabel('YTM')
113 plt.title('Zero coupon yield curve')
114 plt.show()