Python基础之Scipy
Scipy包含致力于解决科学计算中的常见问题的各个工具箱,它的不同子模块对应不同的应用,比如插值、积分、优化、图像处理和特殊函数。Scipy可以与其他标准科学计算程序库如GSL(GNU C或C++科学计算库)或者Matlab工具箱进行比较,是Python中的科学计算程序核心包,用于有效地计算Numpy矩阵,以便于Numpy和Scipy协同工作。
首先介绍下利用plt.rcParams解决结果显示问题:
pylot使用rc配置文件来自定义图形的各种默认属性,称之为rc配置或rc参数。通过rc参数可以修改默认的属性,包括窗体大小、每英寸的点数、线条宽度、颜色、样式、坐标轴、坐标和网络属性、文本、字体等。rc参数存储在字典变量中,通过字典的方式进行访问。具体参照 具体例子
import numpy as np
import pandas as pd
import matplotlib.pyplot as  plt
import datetime as dt
%matplotlib inline

plt.rcParams["font.sans-serif"]=["SimHei"]   #用来正常显示中文标签
plt.rcParams["axes.unicode_minus"]=False   #用来正常显示符号

f=open("E://《Python与量化投资-从理论到实战》 代码//chapter3//data.csv",encoding="utf-8")
data=pd.read_csv(f,index_col="Date")
data.index=[dt.datetime.strptime(x,"%Y-%m-%d") for x in data.index]   #strptime转化时间格式
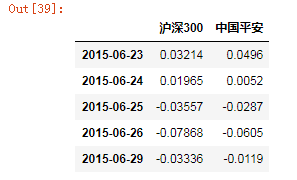
data.head()
data.plot(figsize=(10,6))
plt.ylabel("涨跌幅")
import statsmodels.api as sm

x=data["沪深300"].values
X=sm.add_constant(x)  #添加常数项
y=data["中国平安"].values

model=sm.OLS(y,x)
results=model.fit()
results.params   #查看模型的最终参数
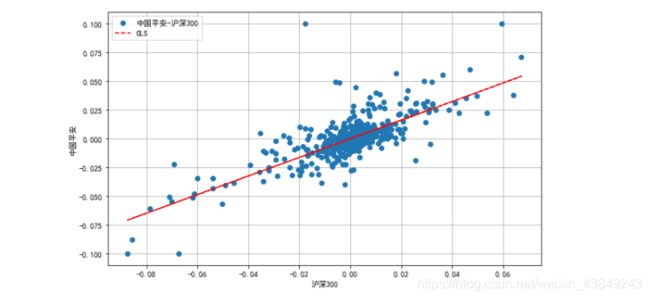
plt.figure(figsize=(10,6))
plt.plot(x,y,"o",label="中国平安-沪深300")
plt.plot(x,results.fittedvalues,"r--",label="OLS")
plt.legend()
plt.xlabel("沪深300")
plt.ylabel("中国平安")
plt.grid(True)

插值:运用scipy.interpolate子库。
插值是离散数据的基础上补插连续函数,使这条连续曲线通过全部给定的离散数据点。插值是离散函数逼近的重要方法,可根据函数在有限个点处的取值状况,估算出函数在其他点的近似值。
这里分享一个阿婆主的插值的解释:####插值解释####
插值使用的函数有splrep函数和splev函数,参数分别如下表:
| 参数 | 描述 |
|---|---|
| x,y | Y=f(x)上的数据点 |
| w | 应用到y坐标上的权重 |
| xb,xe | 拟合区间 |
| s | 平滑因子,权衡相似度与平滑度之间的关系 |
| k | 样条拟合阶数 |
| 参数 | 描述 |
|---|---|
| x | 一组插值点的x坐标 |
| tck | Splrep返回的长度为3的tuple(节点,系数,阶数) |
| der | 导数的阶 |
| ext | 如果x不在节点序列中,则0外推,1返回0,2返回遗产。3返回边界值 |
#读取数据
import scipy.interpolate as spi
X=data.index
Y=data.values
x=np.arange(0,len(data),0.15)

#线性插值和三次样条插值
ipo1=spi.splrep(X,Y,k=1)   #k样条拟合顺序(1《=k<=5)
ipo3=spi.splrep(X,Y,k=3)
iy1=spi.splev(x,ipo1)
iy3=spi.splev(x,ipo3)

#对源数据及插值点进行可视化
fig,(ax1,ax2)=plt.subplots(2,1,figsize=(10,12))
ax1.plot(X,Y,label="沪深300")
ax1.plot(x,iy1,"r.",label="插值点")
ax1.set_ylim(Y.min()-10,Y.max()+10)
ax1.set_ylable("指数")
ax1.set_title("线性插值")
ax1.legend()

ax2.plot(X,Y,label="沪深300")
ax2.plot(x,iy3,"r.",label="插值点")
ax2.set_ylim(Y.min-10,Y.max()+10)
ax2.set_ylabel("指数")
ax2.set_title("三次样条插值")
ax2.legend()
正态分布检验
#打开数据
f=open("E://《Python与量化投资-从理论到实战》 代码//chapter3//data2.csv",encoding="utf-8")
data=pd.read_csv(f,index_col="Date")
data.index=[dt.datetime.strptime(x,"%Y-%m-%d") for x in data.index]
data.head()
#将各股在起始日期的证券价格归一化处理,并进行可视化
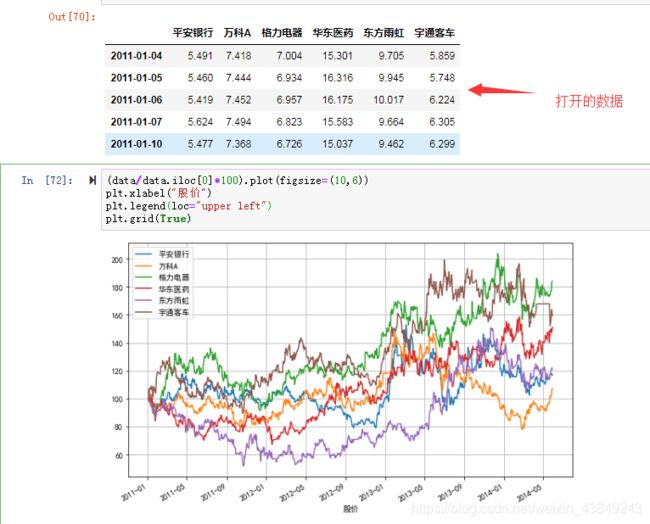
(data/data.iloc[0]*100).plot(figsize=(10,6))
plt.xlabel("股价")
plt.legend(loc="upper left")  #设置图例在左上方,具体legend参数见下链接
plt.grid(True)
这里是legend的参数参考的超链接!

计算每股的对数收益率。所谓的收益率就是简单的每日百分比变化,不考虑红利和其他因素,而是指在一天的交易中股票价值变化的百分比。每日百分比变化的计算很简单,只需使用 Pandas 包中的 pct_change() 函数。
!pct_change()默认遇到缺失值nan按照’pad’方法填充,pct_change(fill_method=‘pad’)
即向前寻找最近的非nan值,计算百分比变动。实际想要的可能是pct_change(fill_method=None)
log_returns=np.log(data.pct_change()+1)
log_returns.head()
log_returns.hist(bins=50,figsize=(10,6),layout=(2,3))

进一步通过分位数-分位数(qq图)来进一步判断各股的对数收益率是否符合正态分布。ststsmodel.api中的qqplot可以实现。
fig,axes=plt.subplots(3,2,figsize=(10,12))
for i in range(0,3):
    for j in range(0,2):
        sm.qqplot(log_returns.iloc[:,2*i+j].dropna(),line="s",ax=axes[i,j])  #dropna()函数删除确实值
        axes[i,j].grid(True)
        axes[i,j].set_title(log_returns.columns[2*i+j])
        axes[i,j].set_ylabel("样本分位数")
        axes[i,j].set_xlabel("理论分位数")
    plt.subplots_adjust(wspace=0.3,hspace=0.4)  #调小分图之间的间距

样本分位数并不在一条直线上,表明各股对数收益率不符合正态分布,在两侧分别有许多值远低于或远高于直线,这就是“肥尾效应”。
凸优化:求最小值的目标函数为凸函数的一类的优化问题。eg:利用市场数据校准齐全定价模型、效用函数优化、投资组合优化等
首先,使用蒙特卡罗模拟生成一定数量的随机投资组合权重向量,并计算其相应的预期投资组合收益及方差:
这是投资组合的详细算法说明参照。。。
import numpy.random as npr
number=10000
stock_num=len(log_returns.columns)
weights=npr.rand(number,stock_num)
weights/=np.sum(weights,axis=1).reshape(number,1)
#计算均值
prets=np.dot(weights,log_returns.mean())*252  #np.dot作矩阵乘法;使用 252 个交易日,从每日收益得出年化收益率
#计算标准差
pvols=np.diag(np.sqrt(np.dot(weights,np.dot(log_returns.cov()*252,weights.T))))
## np.dot(log_returns.cov()*252预期投资组合方差;(预期)投资组合标准差(波动率)只需要计算一次平方根即可得到计算年化风险
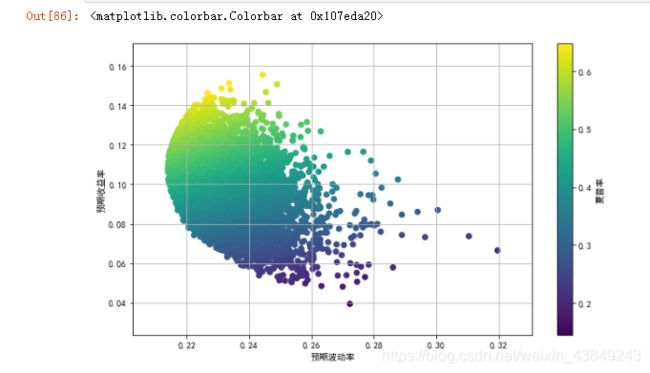
对结果进行可视化,并将无风险短期利率定义为0,以便计算夏普率:
plt.figure(figsize=(10,6))
plt.scatter(pvols,prets,c=prets/pvols,marker="o")
plt.grid(True)
plt.xlabel("预期波动率")
plt.ylabel("预期收益率")
plt.colorbar(label="夏普率")

最优化投资组合的推导就是一个约束最优化问题,使用Scipy.optimize的minimize函数求解:
import scipy.optimize as sco

#建立一个函数将收益率、波动率、夏普率封装起来
def statistics(weights):
    weights=np.array(weights)
    pret=np.sum(log_returns.mean()*weights*252)
    pvols=np.sqrt(np.dot(weights.T,np.dot(log_returns.cov()*252,weights)))
    return np.array([pret,pvols,pret/pvols])

#建立一个目标函数
def min_sharpe(weights):
    return -statistics(weights)[2]

#将所有参数(权重)总和约束为1,将参数的权重限制在0-1:
cons=({"type":"eq","fun":lambda x: np.sum(x)-1})   #约束条件为等式显示
bnds=tuple((0,1) for x in range (stock_num))  #stock_num=6

#调用minimize函数进行最优化求解
opts=sco.minimize(min_sharpe,stock_num*[1/stock_num],method="SLSQP",bounds=bnds,constraints=cons)
 ##  N*[1/N]表示复制N个一维list ,'SLSQP'表示Sequential Least SQuares Programming序贯最小二乘规划
opts["x"].round(3) ##求得优化后组合的权重,保留三位小数

#此时该投资组合的收益率、波动率、夏普率
statistics(opts["x"].round(3))
#风险最小化投资组合
def min_volatility(weights):
    return statistics(weights)[1]
opts1=sco.minimize(min_volatility,stock_num*[1/stock_num],method="SLSQP",bounds=bnds,constraints=cons)
opts1["x"].round(3)
statistics(opts1["x"].round(3))
#收益最大化投资组合
def min_return(weights):
    return -statistics(weights)[0]
opts2=sco.minimize(min_return,stock_num*[1/stock_num],method="SLSQP",bounds=bnds,constraints=cons)
opts2["x"].round(3)
statistics(opts2["x"].round(3))


计算在给定收益的情况下风险最小的投资组合权重,与之前的三个最优化求解过程相比,这一步仅在约束条件上有变化,需要确保预期收益率等于给定的收益率
trets=np.linspace(0.04,0.18,50)  #给定收益率
tvols=[]
for tret in trets:
    cons1=({"type":"eq","fun":lambda x: statistics(x)[0]-tret},{"type":"eq","fun":lambda x: np.sum(x)-1})
    res=sco.minimize(min_volatility,stock_num*([1/stock_num]),method="SLSQP",bounds=bnds,constraints=cons1)
    tvols.append(res["fun"])
tvols=np.array(tvols)

#可视化
plt.figure(figsize=(10,6))
plt.scatter(pvols,prets,c=prets/pvols,marker="o")
plt.scatter(tvols,trets,c=trets/tvols,marker="x",s=100)
plt.plot(statistics(opts["x"])[1],statistics(opts["x"])[0],"*",markersize=15,label="最大夏普率组合")
plt.plot(statistics(opts1["x"])[1],statistics(opts1["x"])[0],"*",markersize=15,label="最小波动率组合")
plt.plot(statistics(opts2["x"])[1],statistics(opts2["x"])[0],"*",markersize=15,label="最大收益率组合")
plt.grid(True)
plt.xlabel("预期波动率")
plt.ylabel("预期收益率")
plt.colorbar(label="夏普率")
plt.legend()


