echars应用
这里写目录标题
- 官网
- 跨域请求
- 饼图
-
- 官网代码
- 我的组件
- 引入官方js效果展示
- 动态获取数据
官网
一个基于 JavaScript 的开源可视化图表库
安装
npm install echarts --save
main.js引用
import * as Echarts from 'echarts'
Vue.config.productionTip = false

Vue.prototype.$echarts = Echarts
跨域请求
配置文件vue.config.js
const { defineConfig } = require('@vue/cli-service')
module.exports = defineConfig({
  transpileDependencies: true
})
module.exports = {
  devServer: {
    proxy: {
      // 和上面自定义的 baseURL 保持一致
      '/api': {
        target: 'http://192.168.10.32:9208',
        changeOrigin: true,
        pathRewrite: { '^/api': '' }
      }
    }
  }
}
拦截器request.js
import axios from 'axios'

const service = axios.create({
  baseURL: '/api',
  timeout: 5000
})

service.interceptors.response.use(
  response => {
    console.log(response)
    // eslint-disable-next-line no-empty
    if (response.status === 200 && response.data) {
      console.log(response)
      return response.data
    } else {
      return Promise.reject(new Error('请求失败'))
    }
  },
  error => {
    return Promise.reject(error)
  }
)

export default service
API文件index.js
import request from '@/utils/request'

// 获取当日各高炉出铁水罐次数
export function getTapCountByToDayAndFurnace() {
  return request({
    url: 'tank/getTapCountByToDayAndFurnace',
    method: 'get'
  })
}

export function getTapCountBy7DayAndFurnace() {
  return request({
    url: 'tank/getTapCountBy7DayAndFurnace',
    method: 'get'
  })
}
饼图
官网代码
复制option里面的代码
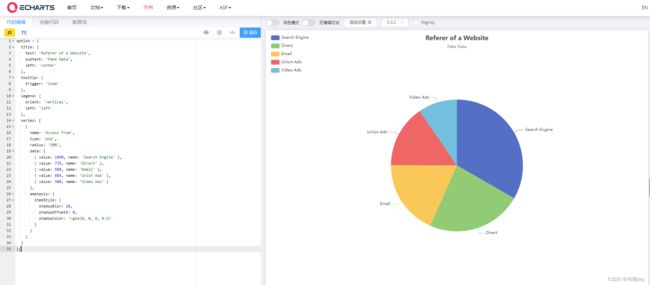
  title: {
    text: 'Referer of a Website',
    subtext: 'Fake Data',
    left: 'center'
  },
  tooltip: {
    trigger: 'item'
  },
  legend: {
    orient: 'vertical',
    left: 'left'
  },
  series: [
    {
      name: 'Access From',
      type: 'pie',
      radius: '50%',
      data: [
        { value: 1048, name: 'Search Engine' },
        { value: 735, name: 'Direct' },
        { value: 580, name: 'Email' },
        { value: 484, name: 'Union Ads' },
        { value: 300, name: 'Video Ads' }
      ],
      emphasis: {
        itemStyle: {
          shadowBlur: 10,
          shadowOffsetX: 0,
          shadowColor: 'rgba(0, 0, 0, 0.5)'
        }
      }
    }
  ]
我的组件
<template>
  <div className="chart-container">
    <div id="chartPie" style="width:100%; height:550px;">div>
  div>
template>

<script>

export default {
  name: 'FilmChart2',
  data () {
    return {
      chartPie: '',
      typeName: [],
      typeNum: []
    }
  },
  methods: {
    drawPieChart () {
      this.chartPie = this.$echarts.init(document.getElementById('chartPie'))
      this.chartPie.setOption({
        // 官网案例代码复制到这
      })
    },
    // 动态获取饼状图的数据
    async initData () {
      this.drawPieChart()
    }
  },
  mounted () {
    this.initData()
  }
}

script>

<style scoped>
style>
注意事项
- id=“chartPie” id是自定义的,要保证唯一性
- this.chartPie.setOption({})钟意的图形js代码填写到这
引入官方js效果展示

vue代码
<template>
  <div className="chart-container">
    <div id="chartPie" style="width:100%; height:550px;">div>
  div>
template>

<script>

export default {
  name: 'FilmChart2',
  data () {
    return {
      chartPie: '',
      typeName: [],
      typeNum: []
    }
  },
  methods: {
    drawPieChart () {
      this.chartPie = this.$echarts.init(document.getElementById('chartPie'))
      this.chartPie.setOption({
        title: {
          text: 'Referer of a Website',
          subtext: 'Fake Data',
          left: 'center'
        },
        tooltip: {
          trigger: 'item'
        },
        legend: {
          orient: 'vertical',
          left: 'left'
        },
        series: [
          {
            name: 'Access From',
            type: 'pie',
            radius: '50%',
            data: [
              { value: 1048, name: 'Search Engine' },
              { value: 735, name: 'Direct' },
              { value: 580, name: 'Email' },
              { value: 484, name: 'Union Ads' },
              { value: 300, name: 'Video Ads' }
            ],
            emphasis: {
              itemStyle: {
                shadowBlur: 10,
                shadowOffsetX: 0,
                shadowColor: 'rgba(0, 0, 0, 0.5)'
              }
            }
          }
        ]
      })
    },
    // 初始化饼状图的数据
    async initData () {
      this.drawPieChart()
    }
  },
  mounted () {
    this.initData()
  }
}

script>

<style scoped>
style>
动态获取数据
关键代码1
    // 初始化饼状图的数据
    async initData () {
    // 动态获取饼状图的数据
      getTapCountByToDayAndFurnace().then(res => {
        this.drawPieChart(res.data)
      })
    }
关键代码2
这里的resData等于res.data
  methods: {
    drawPieChart (resData) {
      this.chartPie = this.$echarts.init(document.getElementById('chartPie'))
      this.chartPie.setOption({
        // 设置标题,副标题,以及标题位置居中
        title: {
          text: '出罐数',
          x: 'center'
        },
        // 具体点击某一项触发的样式内容
        tooltip: {
          trigger: 'item',
          formatter: '{a}
{b} : {c} ({d}%)'
        },
        // 左上侧分类条形符
        legend: {
          orient: 'vertical',
          left: 'left',
          data: resData.name
        },
        // 饼状图类型以及数据源
        series: [
          {
            name: '统计数量',
            type: 'pie',
            // radius: '70%',
            // center: ['50%', '60%'],
            data: resData,
            // 设置饼状图扇形区域的样式
            itemStyle: {
              emphasis: {
                shadowBlur: 10,
                shadowOffsetX: 0,
                shadowColor: 'rgba(0, 0, 0, 0.5)'
              }
            }
          }
        ]
      })
    }
完整代码
<template>
  <div className="chart-container">
    <div id="chartPie" style="width:100%; height:550px;">div>
  div>
template>

<script>
import { getTapCountByToDayAndFurnace } from '@/api'

export default {
  name: 'FilmChart2',
  data () {
    return {
      chartPie: '',
      typeName: [],
      typeNum: []
    }
  },
  methods: {
    drawPieChart (resData) {
      this.chartPie = this.$echarts.init(document.getElementById('chartPie'))
      this.chartPie.setOption({
        // 设置标题,副标题,以及标题位置居中
        title: {
          text: '出罐数',
          x: 'center'
        },
        // 具体点击某一项触发的样式内容
        tooltip: {
          trigger: 'item',
          formatter: '{a}
{b} : {c} ({d}%)'
        },
        // 左上侧分类条形符
        legend: {
          orient: 'vertical',
          left: 'left',
          data: resData.name
        },
        // 饼状图类型以及数据源
        series: [
          {
            name: '统计数量',
            type: 'pie',
            // radius: '70%',
            // center: ['50%', '60%'],
            data: resData,
            // 设置饼状图扇形区域的样式
            itemStyle: {
              emphasis: {
                shadowBlur: 10,
                shadowOffsetX: 0,
                shadowColor: 'rgba(0, 0, 0, 0.5)'
              }
            }
          }
        ]
      })
    },
    // 动态获取饼状图的数据
    async initData () {
      getTapCountByToDayAndFurnace().then(res => {
        this.drawPieChart(res.data)
      })
    }
  },
  mounted () {
    this.initData()
  }
}

script>

<style scoped>
style>
效果
