Python数据分析-房价预测及模型分析
摘 要
Python数据分析-房价的影响因素图解![]() https://blog.csdn.net/weixin_42341655/article/details/120299008?spm=1001.2014.3001.5501
https://blog.csdn.net/weixin_42341655/article/details/120299008?spm=1001.2014.3001.5501
上一篇OF讲述了房价的影响因素,主要是房屋面积、卫生间数、卧室数。今天,我们通过建立模型来预测房价。机器学习中关于回归算法-数据发展的预测,包含了几个模型:
1、线性回归;
2、岭回归;
3、Lasso回归;
4、多项式回归。
线性回归
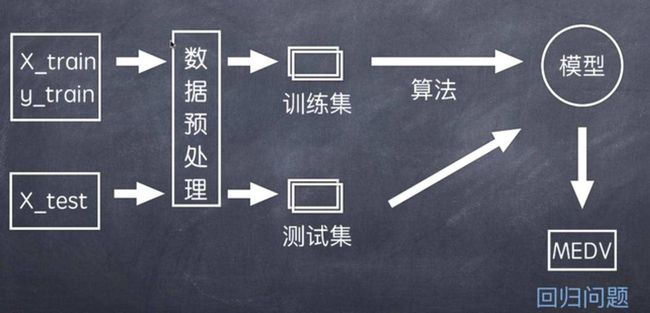
线性回归的公式很简单y=ax+b(a是系数,b是截距),OF借这个简单的公式来介绍下机器学习的过程。
1、定义训练集、测试集;
2、选择模型;
3、训练模型;
4、预测和推断。
import numpy as np
import pandas as pd
from sklearn.model_selection import train_test_split
from sklearn import linear_model
import tkinter as tk
df = pd.read_csv(r"./data/house_data.csv")
#定义训练集、测试集
train_data,test_data = train_test_split(df,train_size = 0.8,random_state=3)
#定义训练数据列
X_train = np.array(train_data['square'], dtype=pd.Series).reshape(-1,1)
y_train = np.array(train_data['price'], dtype=pd.Series)
#定义测试数据列
X_test = np.array(test_data['square'], dtype=pd.Series).reshape(-1,1)
y_test = np.array(test_data['price'], dtype=pd.Series)
#选择模型
lr = linear_model.LinearRegression()
# 训练模型
lr.fit(X_train,y_train)
#预测、推断
pred = lr.predict(X_test)
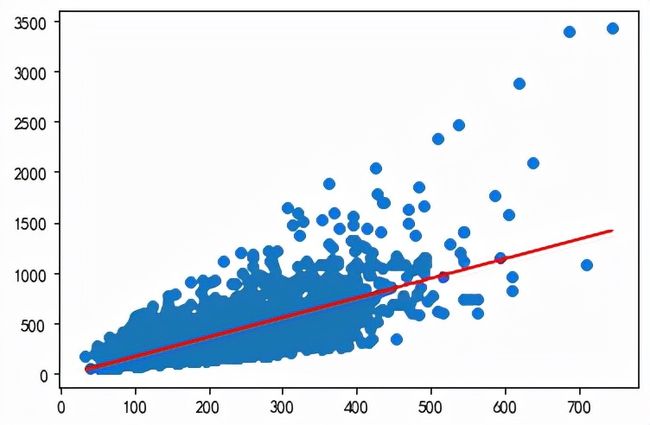
我们来看下预测模型的线性回归是一条怎样的线(下图红色线):
#图表显示
plt.scatter(X_test, y_test)
plt.plot(X_test,pred,color='r')
plt.show()
从肉眼上看,这条线性回归效果似乎并不太理想,我们用数据说话,计算下该模型的评分如何。我们一般用以下指标来衡量模型的好坏:R2(决定系数)、RMSE(均方根误差)、cv(K折交叉验证系数)。我们先看下该模型的R2评分如何:
#计算模型评分
X = np.array(df['square']).reshape(-1,1)
print(lr.score(X,df['price']))
计算结果:
0.4928363894587906R2分数越高,说明模型的准确率越高,低于50%的准确率,模型确实不太理想啊。但既然做出来了,我们用该模型预测下房价。
#计算系数和截距
intercept=float(lr.intercept_)
coef=float(lr.coef_)
print ("Average Price for Test Data: {:.3f}".format(y_test.mean()))
print('Intercept: {}'.format(intercept))
print('Coefficient: {}'.format(coef))
# 第1步,实例化object,建立窗口window
window = tk.Tk()
# 第2步,给窗口的可视化起名字
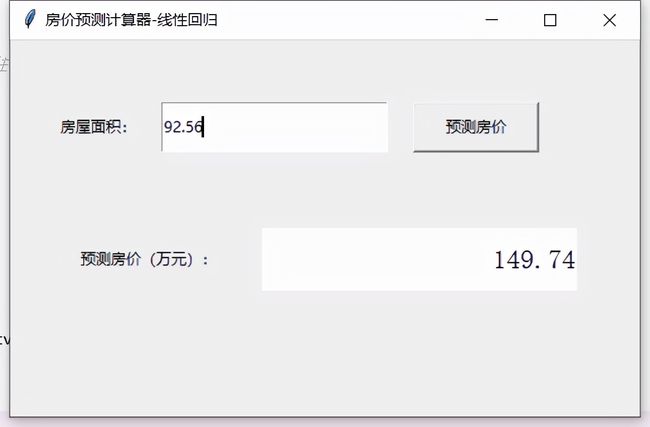
window.title('房价预测计算器-线性回归')
# 第3步,设定窗口的大小(长 * 宽)
window.geometry('500x300')  # 这里的乘是小x
# 第4步,在图形界面上设定输入框控件entry框并放置
a = tk.Label(window, text="房屋面积:")
a.place(x='30',y='50',width='80',height='40')
e = tk.Entry(window, show = None)#显示成明文形式
e.place(x='120',y='50',width='180',height='40')
# 第5步,定义触发事件
def calculate(): # 在鼠标焦点处插入输入内容
    var = e.get()
    ans = coef*float(var)+intercept
    ans = '%.2f'%ans
    result.set(str(ans))
# 第6步,创建并放置一个按钮
b1 = tk.Button(window, text='预测房价', width=10, height=2, command=calculate)
b1.place(x='320',y='50',width='100',height='40')
# 第7步,创建并放置一个多行文本框text用以显示
w = tk.Label(window, text="预测房价(万元):")
w.place(x='50',y='150',width='120',height='50')
result = tk.StringVar()
show_dresult = tk.Label(window, bg='white',fg = 'black',font = ('Arail','16'),bd='0',textvariable=result,anchor='e')
show_dresult.place(x='200',y='150',width='250',height='50')
# 第8步,主窗口循环显示
window.mainloop()
岭回归
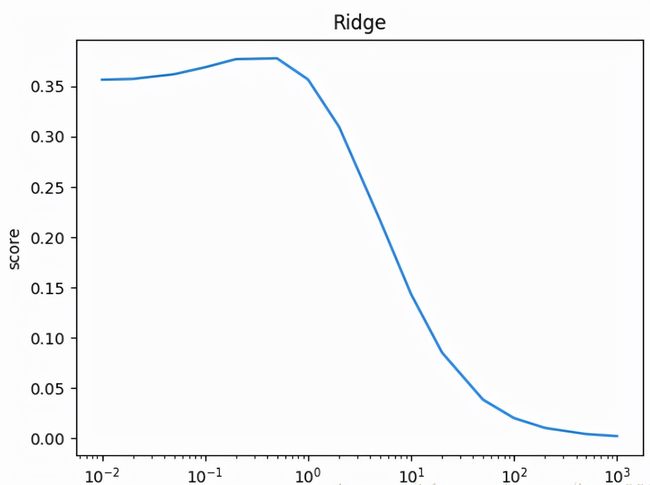
线性回归呈现了房价与房屋面积的关系,但实际上,房价的影响因素可不止面积,还有卫生间数量和卧室数量,当然还有其他一些特征。我们本次用这3个特征进行岭回归预测。岭回归的公式:
import pandas as pd
from sklearn.model_selection import train_test_split
from sklearn import linear_model
import tkinter as tk
df_dm = pd.read_csv(r"./data/house_data.csv")
train_data_dm, test_data_dm = train_test_split(df_dm,train_size = 0.8,random_state=3)
features = ['square','bathrooms','bedrooms']
complex_model_R = linear_model.Ridge(alpha=100)
complex_model_R.fit(train_data_dm[features],train_data_dm['price'])
pred1 = complex_model_R.predict(test_data_dm[features])
intercept=float(complex_model_R.intercept_)
coef=list(complex_model_R.coef_)
print('Intercept: {}'.format(intercept))
print('Coefficients: {}'.format(coef))
#计算模型评分
print(complex_model_R.score(df_dm[features],df_dm['price']))
# 第1步,实例化object,建立窗口window
window = tk.Tk()
# 第2步,给窗口的可视化起名字
window.title('房价预测计算器-岭回归')
# 第3步,设定窗口的大小(长 * 宽)
window.geometry('500x350')  # 这里的乘是小x
# 第4步,在图形界面上设定输入框控件entry框并放置
a = tk.Label(window, text="房屋面积:")
a.place(x='30',y='50',width='80',height='40')
e = tk.Entry(window, show = None)#显示成明文形式
e.place(x='120',y='50',width='180',height='40')
b = tk.Label(window, text="卫生间数:")
b.place(x='30',y='120',width='80',height='40')
f = tk.Entry(window, show = None)#显示成明文形式
f.place(x='120',y='120',width='180',height='40')
c = tk.Label(window, text="卧室数:")
c.place(x='30',y='190',width='80',height='40')
g = tk.Entry(window, show = None)#显示成明文形式
g.place(x='120',y='190',width='180',height='40')
# 第5步,定义触发事件
def calculate(): # 在鼠标焦点处插入输入内容
    var1 = e.get()
    var2 = f.get()
    var3 = g.get()
    ans = coef[0]*float(var1)+coef[1]*float(var2)+coef[2]*float(var3)+intercept
    ans = '%.2f'%ans
    result.set(str(ans))
# 第6步,创建并放置一个按钮
b1 = tk.Button(window, text='预测房价', width=10, height=2, command=calculate)
b1.place(x='350',y='120',width='100',height='40')
# 第7步,创建并放置一个多行文本框text用以显示
w = tk.Label(window, text="预测房价(万元):")
w.place(x='30',y='250',width='120',height='50')
result = tk.StringVar()
show_dresult = tk.Label(window, bg='white',fg = 'black',font = ('Arail','16'),bd='0',textvariable=result,anchor='e')
show_dresult.place(x='200',y='250',width='250',height='50')
# 第8步,主窗口循环显示
window.mainloop()
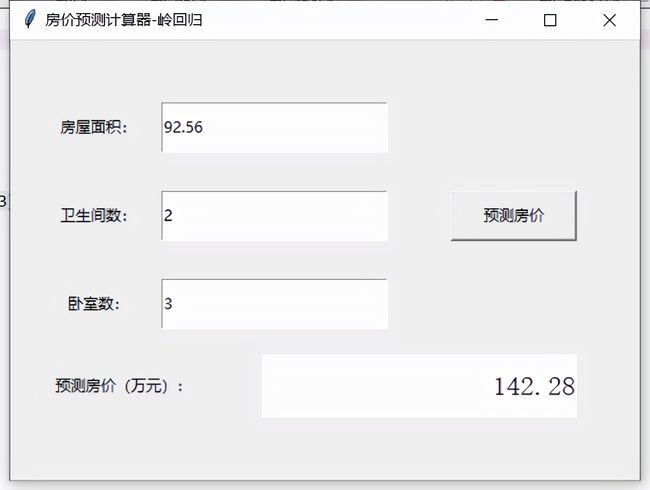
该模型计算得到的评分稍微要高一些:
0.5068817650838495我们用该模型预测的房价结果:
Lasso回归
1)Lasso回归的公式:
2)岭回归与Lasso回归的公式是相同的,Lasso回归与岭回归的区别在于:
Many small/medium sized effects: 使用(Ridge)岭回归
Only a few variables with medium/large effect: 使用Lasso回归
3)岭回归也称为L2 正则化,Lasso回归也称为L1正则化
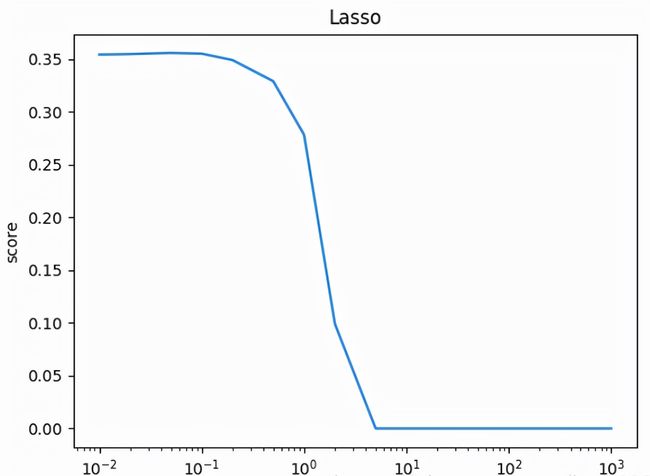
岭回归与Lasso回归最大的区别在于岭回归引入的是L2范数惩罚项,Lasso回归引入的是L1范数惩罚项,Lasso回归能够使得损失函数中的许多θ均变成0,这点要优于岭回归,因为岭回归是要所有的θ均存在的,这样计算量Lasso回归将远远小于岭回归。
Lasso回归最终会趋于一条直线,原因就在于好多θ值已经均为0,而岭回归却有一定平滑度,因为所有的θ值均存在。
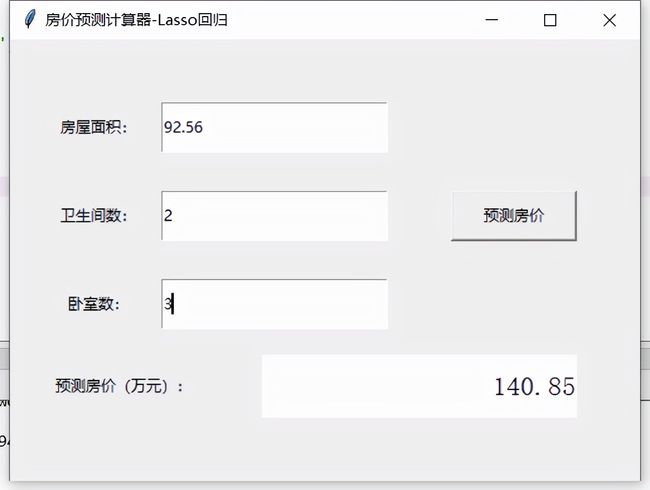
模型评分:0.5067363047097421,并不比岭回归高。
多项式回归
多项式回归的公式:
该模型OF就不过多介绍了,我们的数据集并不太适合,大家想练习下,可以自行尝试下。
结 语
OF主要介绍了3种模型进行房价预测:线性回归、岭回归、Lasso回归。希望大家能够了解机器语言在生活中的应用场景,活学活用,利用学习到的知识解决些生活/工作中的问题。机器学习大概需要学习以下内容:
1、回归算法:数据发展预测
线性回归、多项式回归
2、分类、聚类算法:预测数据类别
二/多项式分类
KNN、SVM、朴素贝叶斯分类
K-means聚类
3、决策树、随机森林算法:数据分类
Boost、GBDT、XGBOOST
4、NLP自然语言
5、深度学习
NN:神经网络
CNN:卷积神经网络
RNN:循环神经网络

