kmean python_机器学习笔记关于python实现Kmean算法
标签:
这次是一个关于Kmean的类聚算法,
简单来说就是到中心点的距离的加权和
看起来很厉害
写出来一点不厉害
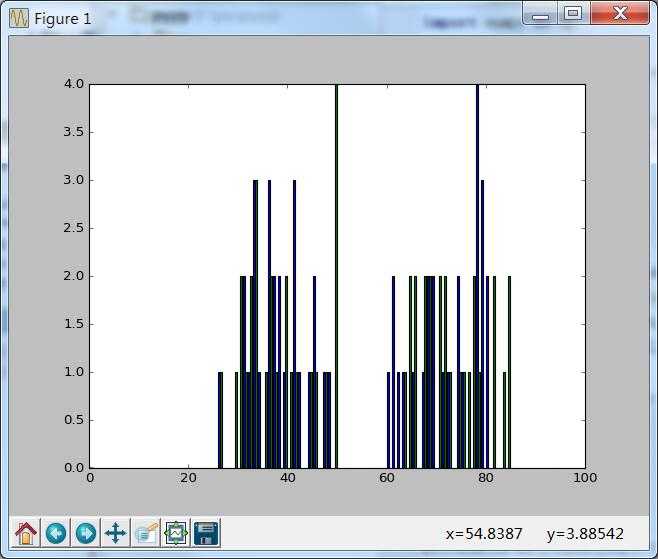
一、随机取点
importnumpy as npimportcv2from matplotlib importpyplot as plt
X= np.random.randint(25,50,(25,2))
Y= np.random.randint(60,85,(25,2))
Z=np.vstack((X,Y))#convert to np.float32
Z =np.float32(Z)
plt.hist(Z,100,[0,100]),plt.show()
二、kmean部分
调用cv2库里的kmean
对A、B两类进行标记
#define criteria and apply kmeans()
criteria = (cv2.TERM_CRITERIA_EPS + cv2.TERM_CRITERIA_MAX_ITER, 10, 1.0)
ret,label,center=cv2.kmeans(Z,2,None,criteria,10,cv2.KMEANS_RANDOM_CENTERS)#Now separate the data, Note the flatten()
A = Z[label.ravel()==0]
B= Z[label.ravel()==1]
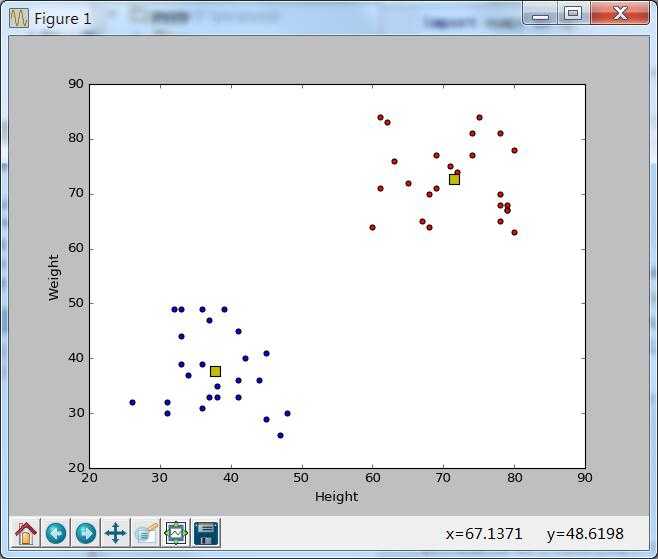
三、类聚结果
画图画图画图
#Plot the data
plt.scatter(A[:,0],A[:,1])
plt.scatter(B[:,0],B[:,1],c = ‘r‘)
plt.scatter(center[:,0],center[:,1],s = 80,c = ‘y‘, marker = ‘s‘)
plt.xlabel(‘Height‘),plt.ylabel(‘Weight‘)
plt.show()
------------------------------------------------------------------------------------------------------------------------------------------------------
最后
代码汇总
import numpy as np
import cv2
from matplotlib import pyplot as plt
X = np.random.randint(25,50,(25,2))
Y = np.random.randint(60,85,(25,2))
Z = np.vstack((X,Y))
# convert to np.float32
Z = np.float32(Z)
plt.hist(Z,100,[0,100]),plt.show()
# define criteria and apply kmeans()
criteria = (cv2.TERM_CRITERIA_EPS + cv2.TERM_CRITERIA_MAX_ITER, 10, 1.0)
ret,label,center=cv2.kmeans(Z,2,None,criteria,10,cv2.KMEANS_RANDOM_CENTERS)
# Now separate the data, Note the flatten()
A = Z[label.ravel()==0]
B = Z[label.ravel()==1]
# Plot the data
plt.scatter(A[:,0],A[:,1])
plt.scatter(B[:,0],B[:,1],c = ‘r‘)
plt.scatter(center[:,0],center[:,1],s = 80,c = ‘y‘, marker = ‘s‘)
plt.xlabel(‘Height‘),plt.ylabel(‘Weight‘)
plt.show()
标签: