使用pytorch构建RNN实现多属性时间序列预测 示例
使用多属性时间序列数据预测风电场实际功率
- 数据展示

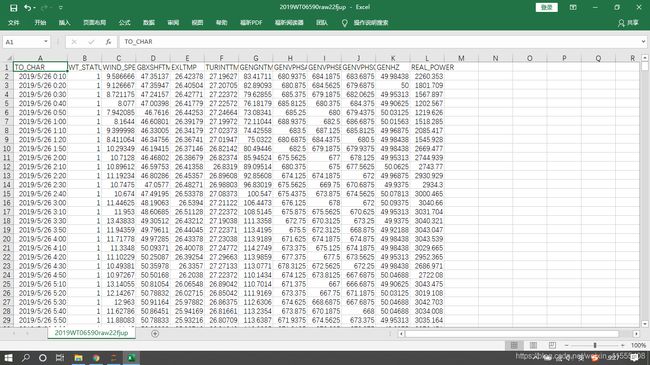
第A列时间数据作为时间索引,第N行B-L列作为特征属性(X),第N+1行L列作为预测属性(y),即用上一时刻的数据预测下一时刻的实际功率。下面的series_to_supervised先把数据构建成X-y形式,实际输入时用多少个时间步长作为输入由超参 time-step决定。 - 实验代码
# 先把数据改成X-y形式,输入用time-step决定
from sklearn import preprocessing
import pandas as pd
import numpy as np
import sys
import torch.optim as optim
import torch
import torch.nn as nn
import matplotlib.pyplot as plt
#使输出完整显示
import numpy as np
np.set_printoptions(threshold=np.inf)
pd.set_option('display.max_rows', None)
pd.set_option('display.max_columns', None)
np.set_printoptions(threshold= sys.maxsize)

#n_in,n_out决定了X-y数据形式,series_to_supervised函数的作用是将n行数据拼接成一条训练数据,
#至于哪部分做X,哪部分做y则由后面数组切片决定(train_X, train_y = train[:, :-1], train[:, -1])
#如果n_in为1代表一条输入作为x,如果n_in为2代表两条输入作为x,以此类推
#如果n_out为1代表往后预测一个时刻的输出,如果n_out为2代表往后预测两个时刻的输出,以此类推
#虽然这部分n_in,n_out的设计并不会对后面的训练有实质的影响,起实质影响的是数组切片(train_X, train_y = train[:, :-1], train[:, -1])
#但最好保证这块输入输出设计与后面的切片一致,方便理解
def series_to_supervised(data, n_in=1, n_out=1, dropnan=True):
    n_vars = 1 if type(data) is list else data.shape[1]
    df = pd.DataFrame(data)
    cols, names = list(), list()
    # input sequence (t-n, ... t-1)
    for i in range(n_in, 0, -1):
        cols.append(df.shift(i))
        names += [('var%d(t-%d)' % (j+1, i)) for j in range(n_vars)]
    # forecast sequence (t, t+1, ... t+n)
    for i in range(0, n_out):
        cols.append(df.shift(-i))
        if i == 0:
            names += [('var%d(t)' % (j+1)) for j in range(n_vars)]
        else:
            names += [('var%d(t+%d)' % (j+1, i)) for j in range(n_vars)]
    # put it all together
    agg = pd.concat(cols, axis=1)
    agg.columns = names
    # drop rows with NaN values
    if dropnan:
        agg.dropna(inplace=True)
    return agg
#     print(agg)
# 加载数据集
dataset = pd.read_csv('E:\\2019winddata\\2019WT06590\\2019WT06590raw22fjup.csv', header=0, index_col=0)
values = dataset.values
# 确保所有数据是浮动的
values = values.astype('float32')
#输入观测值数量和输出观测值数量都是1
reframed = series_to_supervised(dataset, 1, 1)
print(reframed.head())
# 丢弃我们不想预测的列
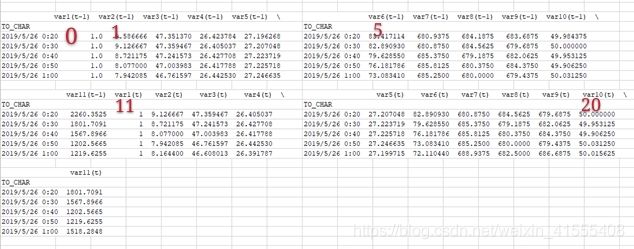
#从0开始计数(第一个属性列为0),索引列不算,11-20对应表格属性中12-21列(如图中红色标号所示)【数据中包括预测标签-实际功率共11个属性】
reframed.drop(reframed.columns[[11,12,12,13,14,15,16,17,18,19,20]], axis=1, inplace=True)
print(reframed.head())
print(reframed.shape)#(779, 12)
#前500条数据用来训练,其后250条用来测试(不用279是因为279没办法划分batch)
# 把数据分为训练集和测试集
values = reframed.values
# print(values.shape)
n_train = 500
train = values[:n_train, :]
test = values[n_train:n_train+250, :]
# 把数据分为输入和输出
#行取所有,第一到倒数第二列为X,最后一列为y
#切片的使用,[行进行切片,列进行切片] 即[start:stop:step,start:stop:step]
train_X, train_y = train[:, :-1], train[:, -1]
test_X, test_y = test[:, :-1], test[:, -1]
true_y = test_y
train_y = train_y.reshape(-1,1)
test_y = test_y.reshape(-1,1)
# shape
# train_X  (500, 11)
# train_y  (500, 1)
# test_X   (250, 11)
# test_y   (500, 1)
#归一化特征,后面预测结果要还原
#这块训练和数据应该分开归一化。先用训练数据归一化,得到参数后,再用来归一化测试数据。X和y也要分开归一化,这样才好inverse。
x_scaler = preprocessing.MinMaxScaler(feature_range=(0, 1))
y_scaler = preprocessing.MinMaxScaler(feature_range=(0, 1))

train_X = x_scaler.fit_transform(train_X)
train_y = y_scaler.fit_transform(train_y)
test_X = x_scaler.transform(test_X)
test_y = y_scaler.transform(test_y)
# 转换成tensor
train_X = torch.tensor(train_X)
# 分成batch
train_X = train_X.reshape(50, 10, 11)

train_y = torch.tensor(train_y)
train_y = train_y.reshape(50, 10, 1)
test_X = torch.tensor(test_X)
test_X = test_X.reshape(25, 10, 11)
test_y = torch.tensor(test_y)
test_y = test_y.reshape(25, 10, 1)
# shape
# train_X.shape  torch.Size([50, 10, 11])
# train_y.shape  torch.Size([50, 10, 1])
# test_X.shape   torch.Size([25, 10, 11])
# test_y.shape   torch.Size([25, 10, 1])
# train_X.size(0)  50
# 定义超参
# Hyper Parameters
TIME_STEP = 10      # rnn time step(步长:使用前TIME_STEP 条数据进行预测)10体现在前面reshape中
INPUT_SIZE = 11      # rnn input size(输入特征维度)
LR = 0.02           # learning rate
optimizer = torch.optim.Adam(rnn.parameters(), lr=LR)   # optimize all cnn parameters
loss_func = nn.MSELoss()

plt.figure(1, figsize=(30, 10))
plt.ion()           # continuously plot

class RNN(nn.Module):
    def __init__(self):
        super(RNN, self).__init__()

        self.rnn = nn.RNN(
            input_size=INPUT_SIZE,
            hidden_size=32,     # rnn hidden unit
            num_layers=1,       # number of rnn layer
            batch_first=True,   # input & output will has batch size as 1s dimension. e.g. (batch, time_step, input_size)
        )
        self.out = nn.Linear(32, 1)


    def forward(self, x, h_state):
        # x (batch, time_step, input_size)
        # h_state (n_layers, batch, hidden_size)
        # r_out (batch, time_step, hidden_size)
        # x包含很多时间步,比如10个时间步的数据可能一起放进来了,但h_state是最后一个时间步的h_state,r_out包含每一个时间步的output
        r_out, h_state = self.rnn(x, h_state)
        #  r_out.shape: torch.Size([50, 10, 32])
        #  h_state.shape: torch.Size([1, 50, 32])
        outs = []    # save all predictions
        for time_step in range(TIME_STEP):
#         for time_step in range(r_out.size(1)):    # calculate output for each time step
            outs.append(self.out(r_out[:, time_step, :]))
        print(" outs: {}".format((torch.stack(outs, dim=1)).shape)) #outs: torch.Size([50, 10, 1])
        return torch.stack(outs, dim=1), h_state
#         return outs, h_state


rnn = RNN()
print(rnn)

i = 0
h_state = None      # for initial hidden state

for step in range(100):
    i=i+1
#保证scalar类型为Double
    rnn = rnn.double()
    prediction, h_state = rnn(train_X, h_state)   # rnn output
#输出是[50, 10, 1],因为RNN预测每一步都有输出,但理论上来讲应该使用最后一步输出才是最准确的,所以后面会尝试只取最后一步值,而不是直接用了[50, 10, 1]
    # !! next step is important !!
    h_state = h_state.data        # repack the hidden state, break the connection from last iteration
    loss = loss_func(prediction, train_y)         # calculate loss'
    print(loss)
    optimizer.zero_grad()                   # clear gradients for this training step
    loss.backward()                         # backpropagation, compute gradients
    optimizer.step()

        #画图
    num = list(range(500))
    # 红色是实际,蓝色是预测
    plt.plot(num, np.array(train_y).flatten().tolist(), 'r-')
    plt.plot(num, prediction.data.numpy().flatten().tolist(), 'b-')
    plt.draw(); plt.pause(0.05)

#test
h_state = None
prediction, h_state = rnn(test_X, h_state)

y1 = np.array(test_y).flatten().tolist()
y2=prediction.data.numpy().flatten()

loss = loss_func(prediction, test_y)
print(loss)
num = list(range(250))
plt.plot(num, y1, 'r-')
plt.plot(num, y2, 'b-')
plt.draw(); plt.pause(0.05)

plt.ioff()
plt.show()
有待改进:
- 数据输入部分格式采用dataloader,而不是一次只能用一个batch;采用多步预测中最后一步的预测值,调整数据输入,每个时间点逐步顺延,而不是切割开,各个batch相互独立(我描述不出来我的想做的。。。)
- 训练 预测数据分布 以上代码的训练效果尚可,测试效果不佳,尤其是测试数据还原后的loss极大。
- 画图loss的下降趋势画出来,方便观察比较
后期工作:
1.梳理RNN网络输入输出变量各维度的实际含义
基于pytorch的RNN各参数含义 实例
2.更改数据加载模式
构造自己的数据集并用dataloader加载
3.完整梳理代码
理想情况下,这些做完后,对CNN网络的理解应该比较到位了,重心就放在网络优化提高预测准确率上了。
目前简单做了只取最后一个时间步的预测值与取每一时间步预测值的loss对比,可能因为数据输入设置的不合理,仅取最后一步预测值的方法只能得到50个训练预测值,25个测试预测值,可能因此也导致了loss反而比取所有时间步的loss还大。后面会研究代码,做出更改,看看效果究竟如何。
参考链接:
Keras中带LSTM的多变量时间序列预测
如何用Python将时间序列转换为监督学习问题
RNN 循环神经网络 (回归) 莫烦

