【gdal学习笔记】利用python 的gdal,以及相关库进行遥感图像处理(影像裁剪,辐射定标,大气校正,异常值去除)——以基于landsat8数据提取NDVI为例
记录最近的学习
参考博客:参考博客
- AtmosphericCorrection大气校正_landsat8_见贤思齐547的博客-CSDN博客
目录
遥感图像预处理
数据介绍
图像裁剪:
辐射定标:
遥感数字图像存储格式
大气校正
计算NDVI
其他一些杂七杂八功能:
测试
遥感图像预处理
数据介绍
本次实验利用合肥市landsat8影像作归一化植被指数NDVI的提取。
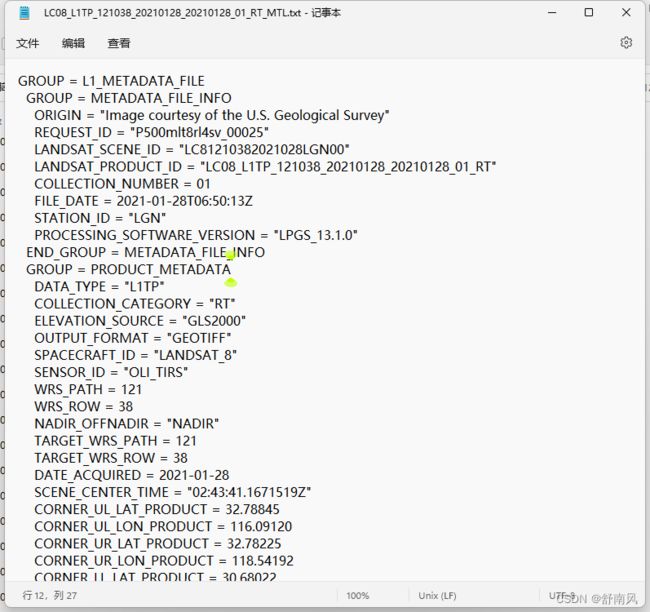
元数据文档:
landsat8数据说明(参考官方使用手册):
关于landsat8数据说明可以参考此文
https://www.cnblogs.com/icydengyw/p/12056211.html
通过上图可以查看你的landsat数据说明。参阅官方文档,依据自己的数据等级,确定要处理哪些操作,哪些操作不进行处理。
开始着手进行操作:
虽然landsat8有许多波段,但一般我们只用可见光波段,也就是1-7波段。在编写相关函数之前,我们应该先编写存取影像的相关类。
如下:
import numpy as np
import shapefile
import glob
from osgeo import gdal_array, gdal
import re


# reader 类
class landsat_reader(object):
    def __init__(self, path):
        # 研究区海拔高度
        self.Altitude = 25
        self.files_arr = []
        # 只要7个波段文件 因为在ENVI里也只展示了可见光的七个波段
        self.bans = 7
        first_file_name = glob.glob("{}/*.tif".format(path))[0]
        for i in range(1, self.bans + 1):
            self.files_arr.append(first_file_name.replace('B1', "B" + str(i)))

    def index(self, i):
        return self.files_arr[i]

    # format_name can choose "GTiff"or "ENVI"
    def mul_com_fun(self, indexs, out_name, format_name="GTiff", mask=1):
        if len(indexs) > 2:
            print("波段合成中")
        data = read_img(self.band(1))
        image = np.zeros((data[3], data[4], len(indexs)), dtype='f4')
        for i in tqdm(range(len(indexs))):
            data2 = read_img(self.band(indexs[i]))
            image[:, :, i] = data2[9]
            del data2
        # 替换所有为零处的数据
        image = np.choose(image == 0, (image, np.nan))
        # 标记代表要不要进行辐射定标与大气校正
        if mask == 1:
            image = self.rad_cai(image, indexs)
            image = self.Atmospheric_correction(image, indexs)

        write_img(out_name, image, data[1], data[2])
        del image
        del data

    def band(self, i):
        return self.files_arr[i - 1]

    def indexs(self):
        return self.files_arr

    def print_filename(self):
        for f in self.files_arr:
            print(f)

    def read_img(self, fileindex):
        read_img(self.files_arr[fileindex])

    def rad_cai(self, image, indexs):
        ...

    def py6s(self, index):

        ...

    # 进入的是一个np数组
    def Atmospheric_correction(self, image, indexs):
        ...
读取图像数据的函数:
# 输入tif文件名
# return im_data, im_proj, im_geotrans, im_height, im_width, im_bands
def read_img(dataset):
    dataset = gdal.Open(dataset)
    im_width = dataset.RasterXSize
    im_height = dataset.RasterYSize
    im_bands = dataset.RasterCount
    im_geotrans = dataset.GetGeoTransform()
    im_proj = dataset.GetProjection()
    im_data = dataset.ReadAsArray()
    # 下面这个读取的是图像第一波段的的矩阵,是个二维矩阵
    im_data_2 = dataset.GetRasterBand(1).ReadAsArray()
    im_dy = dataset.GetRasterBand(1).DataType
    x_ize = dataset.GetRasterBand(1).XSize
    y_ize = dataset.GetRasterBand(1).YSize
    del dataset
    return im_data, im_proj, im_geotrans, im_height, im_width, im_bands, im_dy, x_ize, y_ize, im_data_2
由数组生成图像的保存函数如下:这里需要注意的是,gdal库的数组与np的数组形状不一样。gdal数组的形状是深度在前,行列数在后,而np类型的数组形状波段数在行列之后
# 要输入的是数组化的图像
# 生成指定路径的tif图像
def write_img(output, clip, img_prj, img_trans, format_name):
    # 从该区域读出波段数目,区域大小
    # 根据不同数组的维度进行读取
    Is_GDAL_array = clip.shape[0] < 10
    if len(clip.shape) <= 2:
        im_bands, (im_height, im_width) = 1, clip.shape
    else:
        if Is_GDAL_array:
            im_bands, im_height, im_width = clip.shape
        else:
            im_height, im_width, im_bands = clip.shape
    print(clip.shape)
    gtif_driver = gdal.GetDriverByName(format_name)
    if 'int8' in clip.dtype.name:
        datatype = gdal.GDT_Byte
    elif 'int16' in clip.dtype.name:
        datatype = gdal.GDT_UInt16
    else:
        datatype = gdal.GDT_Float32
    # (第四个参数代表波段数目,最后一个参数为数据类型,跟原文件一致)
    output_tif = gtif_driver.Create(output, im_width, im_height, im_bands, datatype)
    output_tif.SetGeoTransform(img_trans)
    output_tif.SetProjection(img_prj)
    print("开始写入")
    if im_bands == 1:
        output_tif.GetRasterBand(1).WriteArray(clip)
    else:
        for i in range(im_bands):
            if Is_GDAL_array:
                output_tif.GetRasterBand(i + 1).WriteArray(clip[i])
            else:
                output_tif.GetRasterBand(i + 1).WriteArray(clip[:, :, i])
            print(i)

    # 写入磁盘
    output_tif.FlushCache()
    # 计算统计信息
    for i in range(1, im_bands):
        output_tif.GetRasterBand(i).ComputeStatistics(False)
    # 创建概视图或金字塔图层
    output_tif.BuildOverviews('average', [2, 4, 8, 16, 32])
    # 关闭output文件
    del output_tif
    print("成功写入" + output)
对于灰阶图像而言,也就是我们所说的单波段影像,它的存储形式一个二维数组,也就是一个平面 格网上,每一个格网储存着一个像元值。举个例子:
x = np.arange(9.).reshape(3, 3)
print(x)
[[0. 1. 2.]
 [3. 4. 5.]
 [6. 7. 8.]]
# 获取第一行第二个数据可以作如下索引
x[0,1] 数组的行列从索引0开始
1.0
对于多波段图像,只要波段大于二,就采用三维数组存储,波段的数目可以叫做数组的深度。可以理解为多张平面矩阵叠加在一起形成了一个三维空间,我们把深度当作z坐标,xy坐标和原来一样不变。下图用一张三通道图像示意图为例,比如说我们要获取多波段图像上的某一个值,应该这么索引
比如x是一个多波段图像的数组,获取第i行第j列红光波段的dn值,可以这么表示:
(对于一般图像转换成的数组,都是第三位坐标为深度)
x[i, j, 0]
#假设红光波段在第一波段,从这个例子可以看出来,深度的索引也是从0开始的
在遥感图像处理中我们利用GDAL库来将.tif 格式的遥感数组转换为数组,
dataset = gdal.Open("shiyan.tif")  # 打开文件

# ReadAsArray()有参数,如果缺省的话,就返回整个范围的数组,不指定波段的话有可能返回三维数组
im_data = dataset.ReadAsArray()  # 读取栅格图像的像元数组

# 下面这个读取的是图像第一波段的的矩阵,是个二维矩阵
# GetRasterBand(1) ,波段的索引从一开始
im_data_2 = dataset.GetRasterBand(1).ReadAsArray()
而对于写入的库,其方法和读取的库的类似,便不多介绍。
gdal库默认保存的图像是按照像素排列的BIP, 通过这行代码改变形式,改变为BSQ存储格式的
output_tif = gtif_driver.Create(output,
im_width, im_height, im_bands,
datatype, options=["INTERLEAVE=BAND"])
遥感数字图像存储格式
BSQ(波段顺序格式)
BSQ(band sequential format)是按波段保存,也就是一个波段保存后接着保存第二个波段。该格式最适于对单个波谱波段中任何部分的空间(X,Y)存取。
BIL(波段按行交叉格式)
BIL(band interleaved by line format)是按行保存,就是保存第一个波段的第一行后接着保存第二个波段的第一行,依次类推。该格式提供了空间和波谱处理之间一种折衷方式。
BIP(波段按像元交叉格式)
BIP(band interleaved by pixel format)是按像元保存,即先保存第一个波段的第一个像元,之后保存第二波段的第一个像元,依次保存。该格式为图像数据波谱(Z) 的存取提供最佳性能。
我们利用GDAL 库读取的数组形状与使用numpy创建的数组或者其他库创建的数组并不相同:
GDAL数组形状为(波段数,行数,列数),
而numpy数组为(行数,列数,深度)
下面这行代码展示一个(栅格行数,波段数,栅格列数的)
a = np.array(range(27)).reshape(3, 3, 3)
print(a)
"""
[[[ 0  1  2]   第一波段 的第一行 三个数分别为从左往右 第一个像元值,,,,第二个像元值
  [ 3  4  5]   第二波段 的第一行 第一个像元值,,,,
  [ 6  7  8]]  第三波段 的第一行 第一个像元值,,,,

 [[ 9 10 11]   第一波段 的第二行 第一个像元值,,,,
  [12 13 14]   第二波段 的第二行 第一个像元值,,,,
  [15 16 17]]  第三波段 的第二行 第一个像元值,,,,

 [[18 19 20]   第一波段 的第三行 第一个像元值,,,,
  [21 22 23]   第二波段 的第三行 第一个像元值,,,,
  [24 25 26]]] 第三波段 的第三行 第一个像元值,,,,
"""
# 提取第二波段的像元矩阵
print(a[:, 1, :]) # 栅格行数,波段数,栅格列数
"""
[[ 3  4  5]
 [12 13 14]
 [21 22 23]]
"""
图像裁剪:
原理就是读取一个范围内的子图层的数组,再重新保存就好了,这是对于利用.shp文件边界裁剪的情况,如果依据形状裁剪,还需要将不在边界内的像元值变为-999.0或者nan(not a number)。代码展示依据边界的裁剪:
# 三个参数依次为 输入的tif路径 , 输出路径 , 用于裁剪的shp文件路径
def clip_function(input, output, shp):
    input_tif = gdal.Open(input)
    # 读取裁剪的shape文件的外接矩形大小
    shp = shapefile.Reader(shp)
    minX, minY, maxX, maxY = shp.bbox
    # 定义切图的起始点和终点坐标(相比原点的横坐标和纵坐标偏移量)
    offset_x, offset_y = geotoimagexy(input_tif, minX, minY)
    endset_x, endset_y = geotoimagexy(input_tif, maxX, maxY)
    block_xsize = int(endset_x - offset_x + 1)
    block_ysize = int(abs(endset_y - offset_y) + 1)
    # 需要注意的是图像原点在左上角,因此我们要将原点的y向上移动,因为y轴向下,所以符号为减
    offset_y = offset_y - block_ysize
    clip = input_tif.ReadAsArray(offset_x, offset_y, block_xsize, block_ysize)
    img_prj = input_tif.GetProjection()
    img_trans = transform(input_tif.GetGeoTransform(), offset_x, offset_y)
    # 调用保存函数
    print("开始裁剪")
    write_img(output, clip, img_prj, img_trans, "GTiff")
辐射定标:
辐射定标是根据一定的参数将遥感的图像的DN值,就是遥感图像的数据量化值,转换为具有物理意义的值
- 转换为绝对辐射亮度值(辐射率)(对应ENVI辐射定标的定标类型(Calibration Type):辐射率数据Radiance)
- 或者转换与地表(表现)反射率(对应ENVI辐射定标的定标类型(Calibration Type):第二个参数Reflectance)、表面温度等物理量有关的相对值(Temperature
我们将转化为绝对辐射亮度值,因为公式简单好记,公式为L=gain*DN+bias ,而且后续的6s模型也需要输入辐亮度。
我们查看landsat8使用手册:
图中给出了每个波段的参数如何获取,可以通过正则表达式在它的元数据文档中获取对应波长参数
第二种,大气反射率
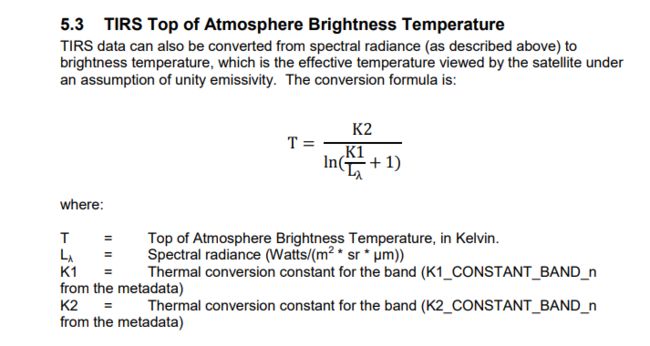
以及辐射亮温:
以定标为辐亮度的方法为例:
代码如下:(这里需要注意的是元数据是16位整型,但是我们要转为话32位浮点型处理,也就是”f4“,在np里代表Float32)
def rad_cai(self, image, indexs):
        print("辐射定标")
        # 读取'MTL.txt'内容
        with open(self.band(1).replace('B1.TIF', 'MTL.txt')) as f:
            content = f.read()
        # 利用正则表达式匹配参数
        gain = re.findall(r'RADIANCE_MULT_BAND_\d\s=\s(\S*)', content)
        bias = re.findall(r'RADIANCE_ADD_BAND_\d\s=\s(\S*)', content)
        new_image = np.zeros_like(image, dtype=np.float32)
        for i in range(len(indexs)):
            new_image[:, :, i] = float(gain[indexs[i]-1]) * image[:, :, i] + float(bias[indexs[i]-1])
        return new_image
左边的图是使用ENVI做的,右边使用上述代码做的,基本差别不大
大气校正
回忆我们在ENVI里进行大气校正时,我们使用的是BIL格式的遥感图像,因为很多教程都说要转为为BIL格式。BIL和BIP格式转换也很简单,新建一个同型数组,在把对应波段储存进去。
在网上查阅资料得知,可以利用Py6s这个库来进行大气校正,不过这个库安装有些麻烦,然而用
Anaconda 安装十分简单。
conda install gdal
conda install -c conda-forge py6s
参考了这篇博客:
https://blog.csdn.net/weixin_40501429/article/details/115856301?spm=1001.2014.3001.5502
    def py6s(self, index):

        # 一些要手动输入的参数
        # avg海拔高度 单位为千米
        self.Altitude = 0.030
        # 气溶胶模型
        # NoAerosols = 0Continental = 1Maritime = 2Urban = 3 Desert = 5BiomassBurning = 6Stratospheric = 7
        Aerosol_Model = 3
        # 设置 50nm气溶胶光学厚度 从这个网站查找  https://aeronet.gsfc.nasa.gov/cgi-bin/type_piece_of_map_opera_v2_new
        aot550 = 0.271
        # 添加 py6s 预定义的
        wavelength = Add_wavelength()
        # 打开landsat8元数据文档
        with open(self.band(1).replace('B1.TIF', 'MTL.txt')) as f:
            content = f.read()
        # 初始化模型,寻找可执行的exe文件
        s = SixS()
        s.geometry = Geometry.User()
        # 设置太阳天顶角和方位角
        solar_z = re.findall(r'SUN_ELEVATION = (\S*)', content)
        solar_a = re.findall(r'SUN_AZIMUTH = (\S*)', content)
        s.geometry.solar_z = 90 - float(solar_z[0])
        s.geometry.solar_a = float(solar_a[0])
        # 卫星天顶角和方位角
        s.geometry.view_z = 0
        s.geometry.view_a = 0
        # 获取 影像 范围
        b_lat = re.findall(r'CORNER_\w*LAT\w*\s=\s(\S*)', content)
        b_lon = re.findall(r'CORNER_\w*LON\w*\s=\s(\S*)', content)
        # 求取影像中心经纬度
        center_lon = np.mean([float(i) for i in b_lon])
        center_lat = np.mean([float(i) for i in b_lat])
        # print(center_lon)
        # print(center_lat)
        # 正则匹配时间,返回月日
        time = re.findall(r'DATE_ACQUIRED = (\d{4})-(\d\d)-(\d\d)', content)
        # print("成像时间是{}年{}月{}日".format(time[0][0], time[0][1], time[0][2]))
        s.geometry.month = int(time[0][1])
        s.geometry.day = int(time[0][2])
        # 大气模式类型
        if -15 < center_lat <= 15:
            s.atmos_profile = AtmosProfile.PredefinedType(AtmosProfile.Tropical)
        if 15 < center_lat <= 45:
            if 4 < s.geometry.month <= 9:
                s.atmos_profile = AtmosProfile.PredefinedType(AtmosProfile.MidlatitudeSummer)
            else:
                s.atmos_profile = AtmosProfile.PredefinedType(AtmosProfile.MidlatitudeWinter)
        if 45 < center_lat <= 60:
            if 4 < s.geometry.month <= 9:
                s.atmos_profile = AtmosProfile.PredefinedType(AtmosProfile.SubarcticSummer)
            else:
                s.atmos_profile = AtmosProfile.PredefinedType(AtmosProfile.SubarcticWinter)

        s.aero_profile = AtmosProfile.PredefinedType(Aerosol_Model)

        # 这个参数不是很明白
        s.ground_reflectance = GroundReflectance.HomogeneousLambertian(0.36)
        # ENVI中这个默认就是40,单位千米
        # s.visibility = 40.0
        # 550nm气溶胶光学厚度
        s.aot550 = aot550
        # 研究区海拔、卫星传感器轨道高度
        s.altitudes = Altitudes()
        s.altitudes.set_target_custom_altitude(self.Altitude)
        # 将传感器高度设置为卫星高度
        s.altitudes.set_sensor_satellite_level()
        """
        PredefinedWavelengths.LANDSAT_OLI_B1
        预定义的波长,根据点后面的关键字查找 ,py6s库里面列出了B1 到 B9的波长
        """
        # 设置b波普响应函数
        s.wavelength = Wavelength(wavelength[index])

        # 下垫面非均一、朗伯体
        s.atmos_corr = AtmosCorr.AtmosCorrLambertianFromReflectance(-0.1)

        # 运行6s大气模型
        s.run()

        xa = s.outputs.coef_xa
        xb = s.outputs.coef_xb
        xc = s.outputs.coef_xc
        x = s.outputs.values
        return xa, xb, xc

    # 进入的是一个np数组
    def Atmospheric_correction(self, image, indexs):
        print("大气校正开始")
        new_image = np.zeros_like(image, dtype=np.float32)
        for i in tqdm(range(len(indexs))):
            a, b, c = self.py6s(indexs[i])
            x = image[:, :, i]
            y = a * x - b
            new_image[:, :, i] = y / (1 + y * c) * 10000
        return new_image
经过对比,发现与ENVI做的同一幅大气校正遥感影像相比,曲线走向类似,不过不同波段对应的最大值有些不同,可能是因为参数不同导致。顺带一提,辐射定标系数用的是1.0
进行下一步:
计算NDVI
开始着手进行操作:
由上图我们可以得知红光波段是band4 ,近红外波段是band5 ,因此得出
计算公式应该为
计算NDVI之后,我们还需要剔除值小于0和大于1的情况
def getndvi(nir_data, red_data):
    try:
        denominator = np.array(nir_data + red_data, dtype='f4')
        numerator = np.array(nir_data - red_data, dtype='f4')
        ndvi = np.divide(numerator, denominator, where=denominator != 0.0)
        # 去除异常值 使得ndvi的值在0与1之间
        ndvi = np.choose((ndvi < 0) + 2 * (ndvi > 1), (ndvi, 0, 0))
        return ndvi

    except BaseException as e:
        print(str(e))
其他处理函数:
线性拉伸,单波段阈值法分类,建立颜色卡,查看灰度直方图之类的
# 此函数进入的是gdal类型数组
# 包括多波段与单波段
def linear_stretch(gray, truncated_value, max_out=255, min_out=0):
    truncated_down = np.percentile(gray, truncated_value)
    truncated_up = np.percentile(gray, 100 - truncated_value)
    gray = (gray - truncated_down) / (truncated_up - truncated_down) * (max_out - min_out) + min_out
    gray = np.choose(gray < min_out + 2 * (gray > max_out), (gray, min_out, max_out))
    gray = np.uint8(gray)
    return gray


# 传入tif文件
def show_hist(src):
    # 直方图
    src_array = read_img(src)[0]
    # 灰度拉伸
    src_array = linear_stretch(src_array, 2)
    plt.hist(src_array)
    plt.title("Single_band_histogram of %s" % src)
    plt.xlabel("x axis caption")
    plt.ylabel("y axis caption")
    print("Histogram display")
    plt.show()


# Image classification by single band threshold method
# Input parameter TIF file, target classification picture, threshold
def classification(src, tgt, threshold):
    print("Image classification start")
    threshold = list(threshold)
    src_data = read_img(src)
    src_array = np.array(src_data[0])
    # 灰度拉伸
    src_array = linear_stretch(src_array, 2)
    Max = np.max(src_array)
    Min = np.min(src_array)
    print("The maximum value of data is%s" % Max)
    print("The minimum value of data is%s" % Min)
    print(src_array)
    # 保存提取结果
    rgb = Create_color_slice(src_array)
    # color = [0, 0, 175]
    # # 掩膜
    # mask = gdal_array.numpy.logical_and(src_array > threshold[0], src_array < threshold[1])
    # rgb = gdal_array.numpy.zeros((3, src_array.shape[0], src_array.shape[1],), gdal_array.numpy.uint8)
    # for i in range(3):
    #     rgb[i] = np.choose(mask, (255, color[i]))
    output = gdal_array.SaveArray(rgb.astype(gdal_array.numpy.uint8), tgt, format="JPEG")
    del output
    del src_data


# 输入np数组
def np_conversion_gdal(array):
    if len(array.shape) == 2:
        gdal_arr = array
    else:
        gdal_arr = gdal_array.numpy.zeros((array.shape[2], array.shape[0], array.shape[1],), gdal_array.numpy.uint8)
    for i in range(array.shape[2]):
        gdal_arr[i] = array[:, :, i]
    return gdal_arr


# 输入gdal类型数组
def gdal_conversion_np(array):
    array2 = array.shape
    np_arr = np.zeros(shape=(array2[1], array2[2], array2[0]))
    for i in range(array2[0]):
        np_arr[:, :, i] = array[i]
    return np_arr


# 输入数组 返回一个gdal类型的数组 ,输入的是灰度直方图
def Create_color_slice(array, bins=10):
    # 获取区间
    # random.randint(0, 255)
    classes = gdal_array.numpy.histogram(array, bins=bins)[1]
    rgb = gdal_array.numpy.zeros((3, array.shape[0], array.shape[1],), gdal_array.numpy.uint8)
    for i in range(bins):
        mask = gdal_array.numpy.logical_and(array > classes[i], array < classes[i + 1])
        for j in tqdm(range(3)):
            rgb[j] = np.choose(mask, (rgb[j], random.randint(0, 255)))
    rgb = rgb.astype(gdal_array.numpy.uint8)
    return rgb
测试
最后我们实际测试一下效果:
# 主函数
if __name__ == "__main__":
    print("主函数开始运行")
    # 读取路径下的landsat文件夹
    file = landsat_reader("./LC81210382021028LGN00")
    # 先对第4波段和第5波段进行辐射校正和大气校正
    file.mul_com_fun([4], "red.tif")
    file.mul_com_fun([5], "nir.tif")
    # 根据裁剪文件进行裁剪
    clip_function("red.tif", "landsat_red.tif", "裁剪用数据/utm50n_mask.shp")
    clip_function("nir.tif", "landsat_nir.tif", "裁剪用数据/utm50n_mask.shp")
    # 读取裁剪后文件
    red_signal = read_img("landsat_red.tif")
    nir_signal = read_img("landsat_nir.tif")
    # 计算植被指数
    ndvi = getndvi(nir_signal[0], red_signal[0])
    write_img("ndvi.tif", ndvi, red_signal[1], red_signal[2])
运行完美:查看效果:


