【机器学习】 吴恩达机器学习作业 ex1 python实现+Matlab实现
文章目录
- 1 简单练习
-
- 输出一个5*5的单位矩阵
- 2 单变量的线性回归
-
- 2.1 Ploting绘图
- 2.2 Cost and Gradient descent单变量梯度下降
- 2.3 代价函数可视化
- 3 多变量线性回归
-
- 3.1 Feature Normalization特征标准化
- 3.2 Gradient Descent 梯度下降
- 3.3 Normal Equations 正规方程
1 简单练习
输出一个5*5的单位矩阵
matlab
A=eye(5)
python
A=np.eye(5)
2 单变量的线性回归
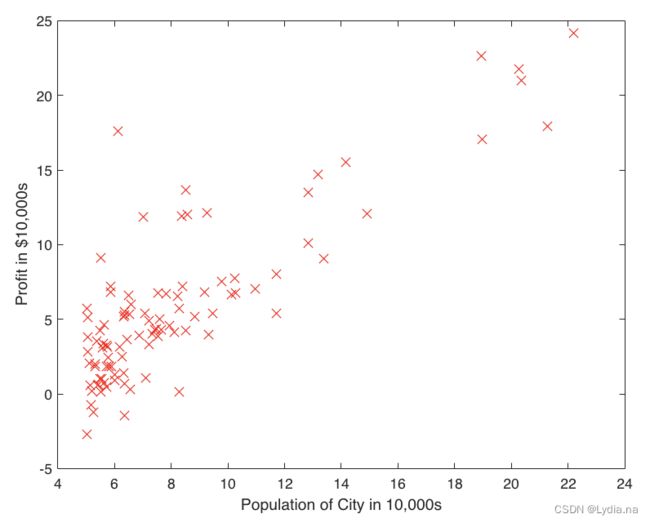
数据集在ex1data1.txt中,第一列是城市人口数,第二列是小吃店利润。
2.1 Ploting绘图
Matlab
//主函数ex1.m中
data = load('ex1data1.txt');
X = data(:, 1); y = data(:, 2);
m = length(y); % number of training examples
plotData(X, y);
//plotData.m中
plot(x,y,'rx','MarkerSize',10);
ylabel('Profit in $10,000s');
xlabel('Population of City in 10,000s');
path='/Users/lina/Desktop/learning/ml/Andrew-NG-Meachine-Learning-master/machine-learning-ex1/ex1/ex1data1.txt'
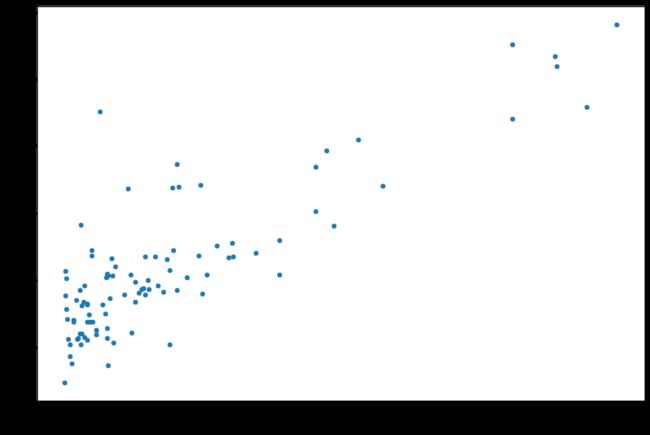
data=pd.read_csv(path,header=None,names=['Population','Profit'])
data.head()
data.plot(kind='scatter',x='Population',y='Profit',figsize=(12,8))
plt.show()
2.2 Cost and Gradient descent单变量梯度下降
matlab
//主函数ex1.m中
X = [ones(m, 1), data(:,1)]; % 对X补一列(theta是2*1的,X的大小为97*1)
theta = zeros(2, 1); % 初始化参数

% 初始数据设置
iterations = 1500;%迭代次数
alpha = 0.01; %学习率

% 计算代价函数
J = computeCost(X, y, theta);
J = computeCost(X, y, [-1 ; 2]); %做测试

% 计算theta的梯度下降结果
theta = gradientDescent(X, y, theta, alpha, iterations);

% 画回归函数与样本数据
hold on; 				% keep previous plot visible
plot(X(:,2), X*theta, '-')
legend('Training data', 'Linear regression')
hold off 				% don't overlay any more plots on this figure

% 预测数据 35,000 and 70,000
predict1 = [1, 3.5] *theta;
fprintf('For population = 35,000, we predict a profit of %f\n',...
    predict1*10000);

predict2 = [1, 7] * theta;
fprintf('For population = 70,000, we predict a profit of %f\n',...
    predict2*10000);
computeCost.m计算代价函数
J=sum((X*theta-y).^2)/(2*m)
gradientDescent.m计算梯度
theta=theta-alpha*(1/m)*(X'*(X*theta-y));
//计算代价函数
def computeCost(X,y,theta):
    inner = np.power((X*theta.T-y),2)
    return np.sum(inner)/(2*len(X))

//初始化参数
data.insert(0,'Ones',1)
cols=data.shape[1]
X=data.iloc[:,:-1]
y=data.iloc[:,cols-1:cols]

//转化为矩阵
X=np.matrix(X.values)
y=np.matrix(y.values)
theta=np.matrix(np.array([0,0]))

//计算当初始值为0的时候的theta值
computeCost(X,y,theta)
计算结果应为32.07
//梯度下降
def gradientDescent(X, y, theta, alpha, iters):
    temp = np.matrix(np.zeros(theta.shape))
    parameters = int(theta.ravel().shape[1])
    cost = np.zeros(iters)

    for i in range(iters):
        error = (X * theta.T) - y

        for j in range(parameters):
            term = np.multiply(error, X[:,j])
            temp[0,j] = theta[0,j] - ((alpha / len(X)) * np.sum(term))

        theta = temp
        cost[i] = computeCost(X, y, theta)

    return theta, cost
#这个部分实现了Ѳ的更新

alpha = 0.01
iters = 1500
//调用函数求出theta
g, cost = gradientDescent(X, y, theta, alpha, iters)

//预测35000和70000城市规模的小吃摊利润
predict1 = [1,3.5]*g.T
print("predict1:",predict1)
predict2 = [1,7]*g.T
print("predict2:",predict2)

//原始数据以及拟合的直线
x = np.linspace(data.Population.min(), data.Population.max(), 100)
f = g[0, 0] + (g[0, 1] * x)

fig, ax = plt.subplots(figsize=(12,8))
ax.plot(x, f, 'r', label='Prediction')
ax.scatter(data.Population, data.Profit, label='Traning Data')
ax.legend(loc=2)
ax.set_xlabel('Population')
ax.set_ylabel('Profit')
ax.set_title('Predicted Profit vs. Population Size')
plt.show()
2.3 代价函数可视化
Matlab
% 初始化theta数值对
theta0_vals = linspace(-10, 10, 100);
theta1_vals = linspace(-1, 4, 100);

% 初始化J_vals矩阵,为100*100共10000对参数值
J_vals = zeros(length(theta0_vals), length(theta1_vals));

% 计算每一对代价函数
for i = 1:length(theta0_vals)
    for j = 1:length(theta1_vals)
	  t = [theta0_vals(i); theta1_vals(j)];
	  J_vals(i,j) = computeCost(X, y, t);
    end
end


% 由于网格网格在 surf 命令中的工作方式,我们需要在调用 surf 之前转置 J_vals,否则轴会被翻转
J_vals = J_vals';
% 画代价函数三维图
figure;
surf(theta0_vals, theta1_vals, J_vals)
xlabel('\theta_0'); ylabel('\theta_1');

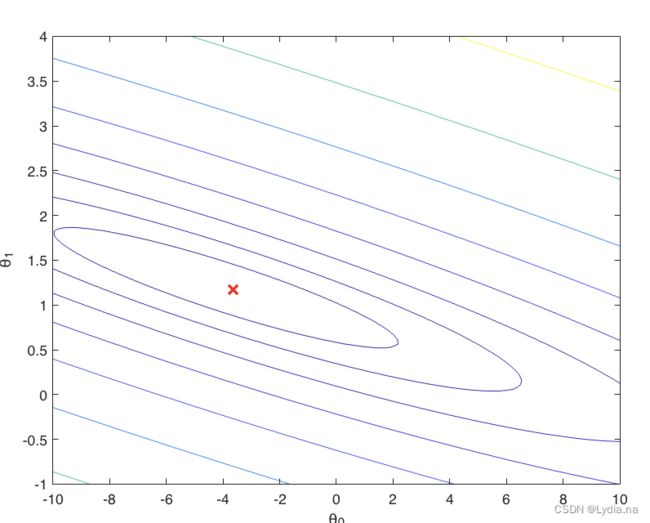
% Contour plot
figure;
% Plot J_vals as 15 contours spaced logarithmically between 0.01 and 100
contour(theta0_vals, theta1_vals, J_vals, logspace(-2, 3, 20))
xlabel('\theta_0'); ylabel('\theta_1');
hold on;
plot(theta(1), theta(2), 'rx', 'MarkerSize', 10, 'LineWidth', 2);
3 多变量线性回归
3.1 Feature Normalization特征标准化
使用ex1data2.txt中的数据,第一列是房屋大小,第二列是卧室数量,第三列是房屋售价。根据已有数据,建立模型,预测房屋售价
Matlab
//主函数
%%加载数据,这里X具有两个变量
data = load(‘ex1data2.txt’);
X = data(:, 1:2);
y = data(:, 3);
m = length(y);
% 特征标准化
[X mu sigma] = featureNormalize(X);
%同单变量时,需要给X添加全为1的一列
X = [ones(m, 1) X];
featureNormalize.m
mu=mean(X_norm);
sigma=mean(X_norm);
X_norm=(X_norm-ones(size(X,1),1)*mu)./(ones(size(X,1),1)*sigma);
进行标准化时,mu需要变为47*2的矩阵,才能对X_norm 每一行进行计算。另外,与之前的类似,matlab中对矩阵与矩阵进行元素对应的除法,需用 “./” 。
python
//读入数据
path='/Users/lina/Desktop/learning/ml/Andrew-NG-Meachine-Learning-master/machine-learning-ex1/ex1/ex1data2.txt'
data2 = pd.read_csv(path, header=None, names=['Size', 'Bedrooms', 'Price'])

data2=(data2-data2.mean())/data2.std()
3.2 Gradient Descent 梯度下降
% 选择5个α值进行计算比较
al = [0.01,0.03,0.1,0.3,1];
num_iters = 400;
plotstyle ={‘r’,‘g’,‘b’,‘y’,‘k’};
% 初始化相应参数
for i =1:length(al)
	alpha =al(i);
	theta = zeros(3, 1);
	[theta, J_history] = gradientDescentMulti(X, y, theta, alpha, num_iters);
	% 绘制梯度收敛图
	plot(1:numel(J_history), J_history, char(plotstyle(i)),‘LineWidth’, 2);				%numel(A),输出A元素个数
	hold on
end
xlabel(‘Number of iterations’);
ylabel(‘Cost J’);
legend({‘alpha=0.01’,‘alpha=0.03’,‘alpha=0.1’,‘alpha=0.3’,‘alpha=1’},‘location’,‘northeast’)
% Display gradient descent’s result
fprintf(‘Theta computed from gradient descent: \n’);
fprintf(’ %f \n’, theta);
% Estimate the price of a 1650 sq-ft, 3 br house
price = [1 ([1650 3] - mu) ./ sigma] * theta;% You should change this
其中涉及到gradientDescentMulti.m和computeCostMulti.m的内容,由于单变量部分已经考虑了向量化,因此在这两处代码一样:
gradientDescentMulti.m
theta=theta-(alpha*(1/m))*(X'*((X*theta)-y));
computeCostMulti.m
J = sum((X*theta-y).^2)/(2*m);
python
# 加一列常数项
data2.insert(0, 'Ones', 1)

# 初始化X和y
cols = data2.shape[1]
X2 = data2.iloc[:,0:cols-1]
y2 = data2.iloc[:,cols-1:cols]

# 转换成matrix格式,初始化theta
X2 = np.matrix(X2.values)
y2 = np.matrix(y2.values)
theta2 = np.matrix(np.array([0,0,0]))

# 运行梯度下降算法
g2, cost2 = gradientDescent(X2, y2, theta2, alpha, iters)
3.3 Normal Equations 正规方程
正规方程,通常在X大小适中的时候使用,否则效率会比梯度下降低:
θ = ( X T X ) − 1 X T y \theta =(X^TX)^{-1}X^Ty θ=(XTX)−1XTy
与梯度下降比较:

Matlab
normalEqn.m
theta=pinv((X'*X))*X'*y; %piv为求逆方式
另外,这里需要在主函数ex1中填入数据集[1650,3]的代码:
price = [ 1 1650 3] * theta;% You should change this
python
# 正规方程
def normalEqn(X, y):
    theta = np.linalg.inv(X.T@X)@X.T@y#X.T@X等价于X.T.dot(X)
    return theta
final_theta2=normalEqn(X, y)#这里用的是data1的数据
final_theta2
参考文章:
吴恩达机器学习ex1 python实现
机器学习编程作业ex1(matlab/octave实现)-吴恩达coursera


