mql4如何自定义画图
mql4里很多自定义指标,将自定义指标拖入途中就能看到曲线图,俗话说,有图有真像,图是如何画的呢?我一直比较好奇,比如iMACD技术参数的图如下:
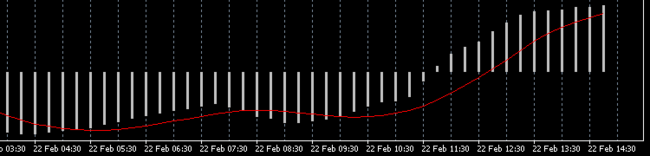
这个图是如何画的呢?
问题1,银色的线垂直的线如何画,红色的曲线如何画
问题2, 两条线的数据是如何获取的 ?
带着这2个问题,我们看下这个源码
还好Mql开放了这个源代码,我们可以研究下, 源码如下
// | Custom MACD.mq4 |
// | Copyright ?2004, MetaQuotes Software Corp. |
// | http://www.metaquotes.net/ |
// +------------------------------------------------------------------+
#property copyright " Copyright ?2004, MetaQuotes Software Corp. "
#property link " http://www.metaquotes.net/ "
// ---- indicator settings
#property indicator_separate_window
#property indicator_buffers 2
#property indicator_color1 Silver
#property indicator_color2 Red
#property indicator_width1 2
// ---- indicator parameters
extern int FastEMA = 12 ;
extern int SlowEMA = 26 ;
extern int SignalSMA = 9 ;
// ---- indicator buffers
double MacdBuffer[];
double SignalBuffer[];
// +------------------------------------------------------------------+
// | Custom indicator initialization function |
// +------------------------------------------------------------------+
int init()
{
// ---- drawing settings
SetIndexStyle( 0 ,DRAW_HISTOGRAM);
SetIndexStyle( 1 ,DRAW_LINE);
SetIndexDrawBegin( 1 ,SignalSMA);
IndicatorDigits(Digits + 1 );
// ---- indicator buffers mapping
SetIndexBuffer( 0 ,MacdBuffer);
SetIndexBuffer( 1 ,SignalBuffer);
// ---- name for DataWindow and indicator subwindow label
IndicatorShortName( " MACD( " + FastEMA + " , " + SlowEMA + " , " + SignalSMA + " ) " );
SetIndexLabel( 0 , " MACD " );
SetIndexLabel( 1 , " Signal " );
// ---- initialization done
return ( 0 );
}
// +------------------------------------------------------------------+
// | Moving Averages Convergence/Divergence |
// +------------------------------------------------------------------+
int start()
{
int limit;
int counted_bars = IndicatorCounted();
// ---- last counted bar will be recounted
if (counted_bars > 0 ) counted_bars -- ;
limit = Bars - counted_bars;
// ---- macd counted in the 1-st buffer
for ( int i = 0 ; i < limit; i ++ )
MacdBuffer[i] = iMA(NULL, 0 ,FastEMA, 0 ,MODE_EMA,PRICE_CLOSE,i) - iMA(NULL, 0 ,SlowEMA, 0 ,MODE_EMA,PRICE_CLOSE,i);
// ---- signal line counted in the 2-nd buffer
for (i = 0 ; i < limit; i ++ )
SignalBuffer[i] = iMAOnArray(MacdBuffer,Bars,SignalSMA, 0 ,MODE_SMA,i);
// ---- done
return ( 0 );
}
// +------------------------------------------------------------------+
定义了有2条线
#property indicator_color2 Red
#property indicator_width1 2
定义线的宽度。
extern int SlowEMA=26;
extern int SignalSMA=9;
iMACD的参数,我也不太明白,但是这对理解图的画法不影响,先不去管它。
double MacdBuffer[];
double SignalBuffer[];
这里是重点,存放数据的数组。
{
//---- drawing settings
SetIndexStyle(0,DRAW_HISTOGRAM);//设置第一条线的显示方式,这里就是垂直
SetIndexStyle(1,DRAW_LINE);//水平线显示
SetIndexDrawBegin(1,SignalSMA); //设置开始画的位置
IndicatorDigits(Digits+1);
//---- indicator buffers mapping
SetIndexBuffer(0,MacdBuffer);
SetIndexBuffer(1,SignalBuffer);
//---- name for DataWindow and indicator subwindow label
IndicatorShortName("MACD("+FastEMA+","+SlowEMA+","+SignalSMA+")");
SetIndexLabel(0,"MACD");
SetIndexLabel(1,"Signal");
//---- initialization done
return(0);
}
// | Custom MACD.mq4 |
// | Copyright ?2004, MetaQuotes Software Corp. |
// | http://www.metaquotes.net/ |
// +------------------------------------------------------------------+
#property copyright " Copyright ?2004, MetaQuotes Software Corp. "
#property link " http://www.metaquotes.net/ "
// ---- indicator settings
#property indicator_separate_window
#property indicator_color1 Red
#property indicator_width1 2
extern int SlowEMA = 26 ;
extern int ma_shift = 0 ;
double MacdBuffer[];
double SignalBuffer[];
// +------------------------------------------------------------------+
// | Custom indicator initialization function |
// +------------------------------------------------------------------+
int init()
{
SetIndexStyle( 0 ,DRAW_HISTOGRAM);
IndicatorDigits(Digits + 1 );
SetIndexBuffer( 0 ,MacdBuffer);
SetIndexLabel( 0 , " iMA " );
return ( 0 );
}
// +------------------------------------------------------------------+
// | Moving Averages Convergence/Divergence |
// +------------------------------------------------------------------+
int start()
{
int limit;
int counted_bars = IndicatorCounted();
// ---- last counted bar will be recounted
if (counted_bars > 0 ) counted_bars -- ;
limit = Bars - counted_bars;
// ---- macd counted in the 1-st buffer
for ( int i = 0 ; i < limit; i ++ )
MacdBuffer[i] = iMA(NULL, 0 ,SlowEMA,ma_shift,MODE_EMA,PRICE_CLOSE,i);
// ---- done
return ( 0 );
}
// +------------------------------------------------------------------+
创建这个脚本的时候请选择Custom indicator 模板来创建,编译后,就可以运行这个脚本了。
希望这篇文章能够对学习mql的朋友有所帮助.
MQL 虽然语法不难,但是那些技术指标好是难懂,希望有兴趣的朋友能够一起学习,探讨,共同进步!