OWC画图-Microsoft Office Chart Component
1.结构
msdn上只找到office2000的资料,仅供参考。
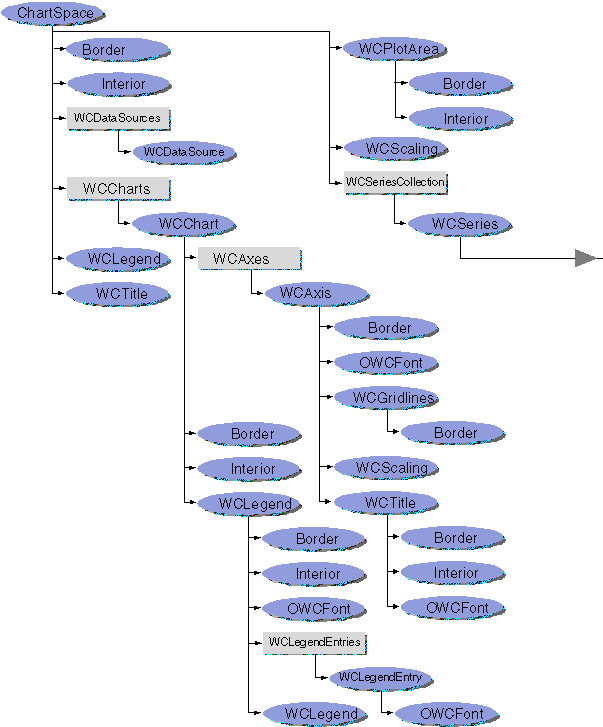
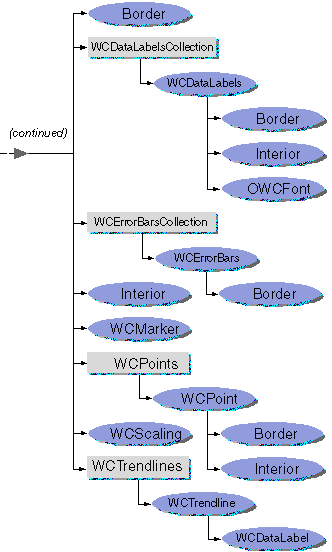
然后自带的文档一般在 安装盘:\Program Files\Common Files\Microsoft Shared\Web Components\11\2052,里面的OWCVBA11.CHM为OWC的VBA编程参考。
2.编程测试
本例子采用VS.NET2005,C#,Office11实现。
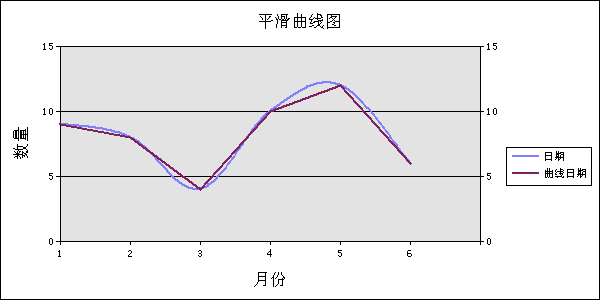
3.测试结果图
单类型图:
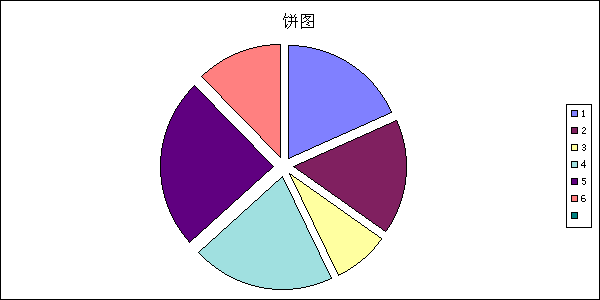
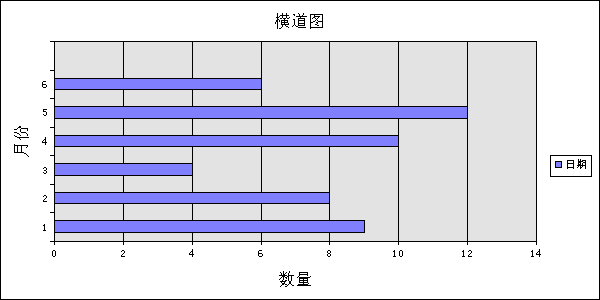
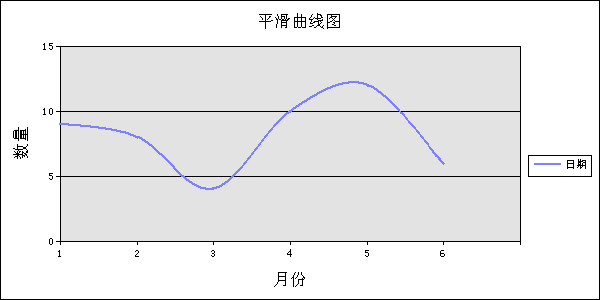
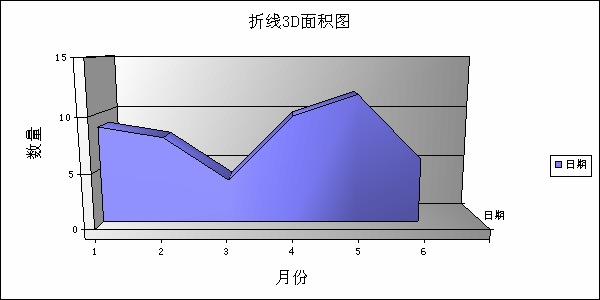
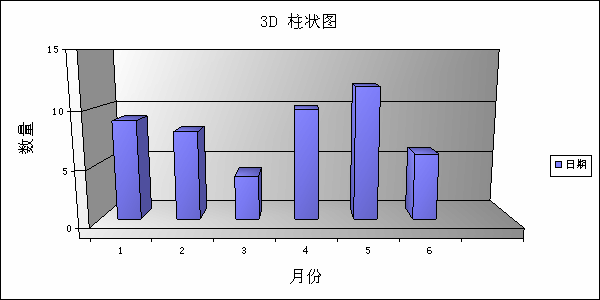
多类型图:
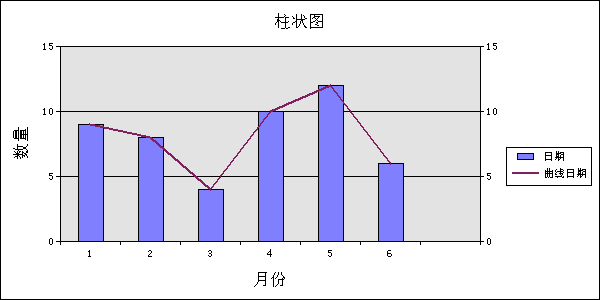
4.参考资料
Office Developer Center http://msdn2.microsoft.com/en-us/library/aa164003(office.10).aspx
如何创建组合图表与图表 Web 组件 http://support.microsoft.com/kb/240263/
2003 .net owc11简单用法! http://blog.csdn.net/pkkfaii/archive/2006/11/14/1384276.aspx
ASP.NET中实时图表的实现 http://blog.csdn.net/yangyifan0/archive/2006/05/17/742416.aspx
microsoft office web 组件(owc11)的编程(.net) http://www.cnblogs.com/mse2002/articles/353731.html
C#编写OWC11组件源代码(2) http://7698.org/c8ccca46-8a4f-4b56-aa38-7f5e254ab6af/
msdn上只找到office2000的资料,仅供参考。


然后自带的文档一般在 安装盘:\Program Files\Common Files\Microsoft Shared\Web Components\11\2052,里面的OWCVBA11.CHM为OWC的VBA编程参考。
2.编程测试
本例子采用VS.NET2005,C#,Office11实现。
1
 using
System;
2 using
System.Data;
3 using
System.Configuration;
4 using
System.Web;
5 using
System.Web.Security;
6 using
System.Web.UI;
7 using
System.Web.UI.WebControls;
8 using
System.Web.UI.WebControls.WebParts;
9 using
System.Web.UI.HtmlControls;
10 using
System.ComponentModel;
11
12 public
partial
class
_Default : System.Web.UI.Page
13

 {
{
14 protected void Page_Load(object sender, EventArgs e)
15

 {
{
16 createPicture("test01.gif", Microsoft.Office.Interop.Owc11.ChartChartTypeEnum.chChartTypeColumnClustered3D, "3D 柱状图");
17 createPicture("test02.gif", Microsoft.Office.Interop.Owc11.ChartChartTypeEnum.chChartTypeSmoothLine, "平滑曲线图");
18 createPicture("test03.gif", Microsoft.Office.Interop.Owc11.ChartChartTypeEnum.chChartTypeArea, "折线面积图");
19 createPicture("test04.gif", Microsoft.Office.Interop.Owc11.ChartChartTypeEnum.chChartTypeArea3D, "折线3D面积图");
20 createPicture("test05.gif", Microsoft.Office.Interop.Owc11.ChartChartTypeEnum.chChartTypeAreaOverlapped3D, "折线3D面积图");
21 createPicture("test06.gif", Microsoft.Office.Interop.Owc11.ChartChartTypeEnum.chChartTypeAreaStacked, "折线面积图加边框");
22 createPicture("test07.gif", Microsoft.Office.Interop.Owc11.ChartChartTypeEnum.chChartTypeAreaStacked, "折线面积图加边框");
23 createPicture("test08.gif", Microsoft.Office.Interop.Owc11.ChartChartTypeEnum.chChartTypeAreaStacked100, "折线面积图加边框百分比图");
24 createPicture("test09.gif", Microsoft.Office.Interop.Owc11.ChartChartTypeEnum.chChartTypeAreaStacked1003D, "折线3D面积图加边框百分比图");
25 createPicture("test11.gif", Microsoft.Office.Interop.Owc11.ChartChartTypeEnum.chChartTypeAreaStacked3D, "折线3D面积图加边框");
26 createPicture("test12.gif", Microsoft.Office.Interop.Owc11.ChartChartTypeEnum.chChartTypeBar3D, "横道图3D");
27 createPicture("test13.gif", Microsoft.Office.Interop.Owc11.ChartChartTypeEnum.chChartTypeBarClustered, "横道图");
28 createPicture("test14.gif", Microsoft.Office.Interop.Owc11.ChartChartTypeEnum.chChartTypeBarStacked, "横道图3D");
29 createPicture("test15.gif", Microsoft.Office.Interop.Owc11.ChartChartTypeEnum.chChartTypeBarStacked100, "横道图3D百分比图");
30 createPicture("test16.gif", Microsoft.Office.Interop.Owc11.ChartChartTypeEnum.chChartTypeBarStacked1003D, "横道图3D百分比图");
31
32 createPicture("test17.gif", Microsoft.Office.Interop.Owc11.ChartChartTypeEnum.chChartTypeColumnClustered, "柱状图");
33 createPicture("test18.gif", Microsoft.Office.Interop.Owc11.ChartChartTypeEnum.chChartTypeColumnClustered3D, "柱状图3D");
34 createPicture("test19.gif", Microsoft.Office.Interop.Owc11.ChartChartTypeEnum.chChartTypeColumnStacked, "柱状图");
35 createPicture("test20.gif", Microsoft.Office.Interop.Owc11.ChartChartTypeEnum.chChartTypeColumnStacked100, "柱状图3D百分比图 ");
36 createPicture("test21.gif", Microsoft.Office.Interop.Owc11.ChartChartTypeEnum.chChartTypeColumnStacked100, "柱状图3D百分比图");
37 createPicture("test22.gif", Microsoft.Office.Interop.Owc11.ChartChartTypeEnum.chChartTypeColumnStacked, "柱状图");
38
39 createPicture("test23.gif", Microsoft.Office.Interop.Owc11.ChartChartTypeEnum.chChartTypePie, "饼图", false);
40 createPicture("test24.gif", Microsoft.Office.Interop.Owc11.ChartChartTypeEnum.chChartTypePie3D, "饼图", false);
41 createPicture("test25.gif", Microsoft.Office.Interop.Owc11.ChartChartTypeEnum.chChartTypePieExploded, "饼图", false);
42 createPicture("test26.gif", Microsoft.Office.Interop.Owc11.ChartChartTypeEnum.chChartTypePieExploded3D, "饼图", false);
43 createPicture("test27.gif", Microsoft.Office.Interop.Owc11.ChartChartTypeEnum.chChartTypePieStacked, "饼图", false);
44
45 //createPicture("test28.gif",Microsoft.Office.Interop.Owc11.ChartChartTypeEnum.chChartTypeBubble, "测试统计图"); //测试不通过
46 //createPicture("test29.gif",Microsoft.Office.Interop.Owc11.ChartChartTypeEnum.chChartTypeBubbleLine, "测试统计图"); //测试不通过
47
48 }
}
49
50
51 private void createPicture(string fileName, Microsoft.Office.Interop.Owc11.ChartChartTypeEnum type, string title)
52

 {
{
53 this.createPicture(fileName,type, title, true);
54 }
}
55
56 private void createPicture(string fileName,Microsoft.Office.Interop.Owc11.ChartChartTypeEnum type, string title,bool hasAxes)
57

 {
{
58 string strCategory = "1" + '\t' + "2" + '\t' + "3" + '\t' + "4" + '\t' + "5" + '\t' + "6" + '\t';
59 string strValue = "9" + '\t' + "8" + '\t' + "4" + '\t' + "10" + '\t' + "12" + '\t' + "6" + '\t';
60
61 //图表工作区
62 Microsoft.Office.Interop.Owc11.ChartSpace thisChartSpace = new Microsoft.Office.Interop.Owc11.ChartSpace();
63 //增加一个图表
64 Microsoft.Office.Interop.Owc11.ChChart thisChChart = thisChartSpace.Charts.Add(0);
65 //增加一个图表上的系列
66 Microsoft.Office.Interop.Owc11.ChSeries thisChSeries = thisChChart.SeriesCollection.Add(0);
67
68 //显示图例
69 thisChChart.HasLegend = true;
70
71 //设置标题
72 thisChChart.HasTitle = true;
73 thisChChart.Title.Caption = title;
74
75 //图表类型
76 thisChChart.Type = type;
77
78 //旋转
//旋转
79 thisChChart.Rotation = 360.00;
80 //设置倾斜度
81 thisChChart.Inclination = 10.00;
82
83 if (hasAxes)
84

 {
{
85
86 //给定x,y轴图示说明
87 thisChChart.Axes[0].HasTitle = true;
88 thisChChart.Axes[0].Title.Caption = "月份";
89
90 thisChChart.Axes[1].HasTitle = true;
91 thisChChart.Axes[1].Title.Caption = "数量";
92 }
}
93
94
95
 /**/////底色
96 //thisChChart.PlotArea.Floor.Interior.Color = "green";
97
 /**/////背景颜色
98 //thisChChart.PlotArea.Interior.Color = "red";
99
100 //重叠
//重叠
101 //thisChChart.Overlap = 50;
102
103 //*********************************************************************
104 //设置指定图表对象的数据。
105 //expression.SetData(Dimension, DataSourceIndex, DataReference)
106 //
//
107 //Dimension ChartDimensionsEnum 常量,必需。指定设置的数据维。
108 //ChartDimensionsEnum 可以为下列 ChartDimensionsEnum 常量之一。
109 // chDimBubbleValues 设置气泡图上的标志值。
110 // chDimCategories 设置用作分类的值。
111 // chDimCharts 在 HasMultipleCharts 属性设置为 True 时设置新图表的来源字段。
112 // chDimCloseValues 设置股票图的收盘值。
113 // chDimFilter 设置放置于筛选坐标轴的字段。
114 // chDimFormatValues 设置格式映射中的值。
115 // chDimHighValues 设置股票图的盘高值。
116 // chDimLowValues 设置股票图的盘低值。
117 // chDimOpenValues 设置股票图的开盘值。
118 // chDimRValues 设置极坐标图的 R 值。
119 // chDimSeriesNames 设置作为系列名称的值。
120 // chDimThetaValues 设置极坐标图的极角值。
121 // chDimValues 设置绘制图表的值。
122 // chDimXValues 设置 XY 散点图或气泡图的 X 值。
123 // chDimYValues 设置 XY 散点图或气泡图的 Y 值。
124 //
//
125 //DataSourceIndex Long 类型,必需。可以为 ChartSpecialDataSourcesEnum 常量。
126 // ChartSpecialDataSourcesEnum 可以为下列 ChartSpecialDataSourcesEnum 常量之一。
127 // chDataBound 将指定对象绑定到 DataReference 参数指定的外部数据源。
128 // chDataLinked 将指定对象绑定到其他维。在 Dimension 参数中指定 chDimFormatValues 创建格式映射时使用该值。
129 // chDataLiteral 将指定对象绑定到 DataReference 参数指定的文字类型数据。
130 // chDataNone 清除指定对象。
131 //
//
132 //DataReference Variant 类型,可选。
133 //对于 ChChart 和 ChSeries 对象,该参数以 Microsoft Excel 样式的区域引用(例如,“A1:D4”)或行集的列名指定数据引用。
134 //如果 DataSourceIndex 参数设置为 chDataLiteral,可以将 DataReference 设置为一维数组或逗号分隔列表。
135 //对于 ChErrorBars 对象,该参数指定可用作误差线数值的 Double 或 String 数组。
136 //请注意该参数仅适用于自定义误差线(误差线的 Type 属性必须设置为 chErrorBarTypeCustom)。
137
138
139 //设置图标对象中作为系列名称的值
140 thisChSeries.SetData(Microsoft.Office.Interop.Owc11.ChartDimensionsEnum.chDimSeriesNames, Microsoft.Office.Interop.Owc11.ChartSpecialDataSourcesEnum.chDataLiteral.GetHashCode(), "日期");
141 //设置图标对象中用作分类的值
142 thisChSeries.SetData(Microsoft.Office.Interop.Owc11.ChartDimensionsEnum.chDimCategories, Microsoft.Office.Interop.Owc11.ChartSpecialDataSourcesEnum.chDataLiteral.GetHashCode(), strCategory);
143 //设置图标对象中用作数据的值
144 thisChSeries.SetData(Microsoft.Office.Interop.Owc11.ChartDimensionsEnum.chDimValues, Microsoft.Office.Interop.Owc11.ChartSpecialDataSourcesEnum.chDataLiteral.GetHashCode(), strValue);
145
146
147
148
149
150 //******
151 //下面为增加图标类型代码,取消注释运行就可以
152 //******
153
154 //增加另外一个图表上的系列
155 //Microsoft.Office.Interop.Owc11.ChSeries thisChSeries2 = thisChChart.SeriesCollection.Add(0);
156
157
 /**/////设置图标对象中作为系列名称的值
158 //thisChSeries2.SetData(Microsoft.Office.Interop.Owc11.ChartDimensionsEnum.chDimSeriesNames, Microsoft.Office.Interop.Owc11.ChartSpecialDataSourcesEnum.chDataLiteral.GetHashCode(), "曲线日期");
159
 /**///////设置图标对象中用作分类的值
160 //thisChSeries2.SetData(Microsoft.Office.Interop.Owc11.ChartDimensionsEnum.chDimCategories, Microsoft.Office.Interop.Owc11.ChartSpecialDataSourcesEnum.chDataLiteral.GetHashCode(), strCategory);
161
 /**///////设置图标对象中用作数据的值
162 //thisChSeries2.SetData(Microsoft.Office.Interop.Owc11.ChartDimensionsEnum.chDimValues, Microsoft.Office.Interop.Owc11.ChartSpecialDataSourcesEnum.chDataLiteral.GetHashCode(), strValue);
163
164
 /**/////设置第二个图的类型
165 //thisChSeries2.Type = Microsoft.Office.Interop.Owc11.ChartChartTypeEnum.chChartTypeLine;
166
167
 /**/////设置刻度
168 //Microsoft.Office.Interop.Owc11.ChAxis chAxis = thisChChart.Axes.Add(thisChChart.get_Scalings(Microsoft.Office.Interop.Owc11.ChartDimensionsEnum.chDimValues));
169 //chAxis.Position = Microsoft.Office.Interop.Owc11.ChartAxisPositionEnum.chAxisPositionRight; //刻度在右边
170
171
172 //到处图像文件
173 try
try
174

 {
{
175 thisChartSpace.ExportPicture(Server.MapPath(fileName), "gif", 600, 300);
176 Response.Write("<img src='" + Server.MapPath(fileName) + "'/>");
177
178 }
}
179 catch (Exception ex)
180

 {
{
181 //抛出异常信息
182 Response.Write(ex);
183 }
}
184 }
}
185 }
}
186
 using
System;
using
System;2
 using
System.Data;
using
System.Data;3
 using
System.Configuration;
using
System.Configuration;4
 using
System.Web;
using
System.Web;5
 using
System.Web.Security;
using
System.Web.Security;6
 using
System.Web.UI;
using
System.Web.UI;7
 using
System.Web.UI.WebControls;
using
System.Web.UI.WebControls;8
 using
System.Web.UI.WebControls.WebParts;
using
System.Web.UI.WebControls.WebParts;9
 using
System.Web.UI.HtmlControls;
using
System.Web.UI.HtmlControls;10
 using
System.ComponentModel;
using
System.ComponentModel;11

12
 public
partial
class
_Default : System.Web.UI.Page
public
partial
class
_Default : System.Web.UI.Page13


 {
{14
 protected void Page_Load(object sender, EventArgs e)
15


 {
{16
 createPicture("test01.gif", Microsoft.Office.Interop.Owc11.ChartChartTypeEnum.chChartTypeColumnClustered3D, "3D 柱状图");
17
 createPicture("test02.gif", Microsoft.Office.Interop.Owc11.ChartChartTypeEnum.chChartTypeSmoothLine, "平滑曲线图");
18
 createPicture("test03.gif", Microsoft.Office.Interop.Owc11.ChartChartTypeEnum.chChartTypeArea, "折线面积图");
19
 createPicture("test04.gif", Microsoft.Office.Interop.Owc11.ChartChartTypeEnum.chChartTypeArea3D, "折线3D面积图");
20
 createPicture("test05.gif", Microsoft.Office.Interop.Owc11.ChartChartTypeEnum.chChartTypeAreaOverlapped3D, "折线3D面积图");
21
 createPicture("test06.gif", Microsoft.Office.Interop.Owc11.ChartChartTypeEnum.chChartTypeAreaStacked, "折线面积图加边框");
22
 createPicture("test07.gif", Microsoft.Office.Interop.Owc11.ChartChartTypeEnum.chChartTypeAreaStacked, "折线面积图加边框");
23
 createPicture("test08.gif", Microsoft.Office.Interop.Owc11.ChartChartTypeEnum.chChartTypeAreaStacked100, "折线面积图加边框百分比图");
24
 createPicture("test09.gif", Microsoft.Office.Interop.Owc11.ChartChartTypeEnum.chChartTypeAreaStacked1003D, "折线3D面积图加边框百分比图");
25
 createPicture("test11.gif", Microsoft.Office.Interop.Owc11.ChartChartTypeEnum.chChartTypeAreaStacked3D, "折线3D面积图加边框");
26
 createPicture("test12.gif", Microsoft.Office.Interop.Owc11.ChartChartTypeEnum.chChartTypeBar3D, "横道图3D");
27
 createPicture("test13.gif", Microsoft.Office.Interop.Owc11.ChartChartTypeEnum.chChartTypeBarClustered, "横道图");
28
 createPicture("test14.gif", Microsoft.Office.Interop.Owc11.ChartChartTypeEnum.chChartTypeBarStacked, "横道图3D");
29
 createPicture("test15.gif", Microsoft.Office.Interop.Owc11.ChartChartTypeEnum.chChartTypeBarStacked100, "横道图3D百分比图");
30
 createPicture("test16.gif", Microsoft.Office.Interop.Owc11.ChartChartTypeEnum.chChartTypeBarStacked1003D, "横道图3D百分比图");
31

32
 createPicture("test17.gif", Microsoft.Office.Interop.Owc11.ChartChartTypeEnum.chChartTypeColumnClustered, "柱状图");
33
 createPicture("test18.gif", Microsoft.Office.Interop.Owc11.ChartChartTypeEnum.chChartTypeColumnClustered3D, "柱状图3D");
34
 createPicture("test19.gif", Microsoft.Office.Interop.Owc11.ChartChartTypeEnum.chChartTypeColumnStacked, "柱状图");
35
 createPicture("test20.gif", Microsoft.Office.Interop.Owc11.ChartChartTypeEnum.chChartTypeColumnStacked100, "柱状图3D百分比图 ");
36
 createPicture("test21.gif", Microsoft.Office.Interop.Owc11.ChartChartTypeEnum.chChartTypeColumnStacked100, "柱状图3D百分比图");
37
 createPicture("test22.gif", Microsoft.Office.Interop.Owc11.ChartChartTypeEnum.chChartTypeColumnStacked, "柱状图");
38

39
 createPicture("test23.gif", Microsoft.Office.Interop.Owc11.ChartChartTypeEnum.chChartTypePie, "饼图", false);
40
 createPicture("test24.gif", Microsoft.Office.Interop.Owc11.ChartChartTypeEnum.chChartTypePie3D, "饼图", false);
41
 createPicture("test25.gif", Microsoft.Office.Interop.Owc11.ChartChartTypeEnum.chChartTypePieExploded, "饼图", false);
42
 createPicture("test26.gif", Microsoft.Office.Interop.Owc11.ChartChartTypeEnum.chChartTypePieExploded3D, "饼图", false);
43
 createPicture("test27.gif", Microsoft.Office.Interop.Owc11.ChartChartTypeEnum.chChartTypePieStacked, "饼图", false);
44

45
 //createPicture("test28.gif",Microsoft.Office.Interop.Owc11.ChartChartTypeEnum.chChartTypeBubble, "测试统计图"); //测试不通过
46
 //createPicture("test29.gif",Microsoft.Office.Interop.Owc11.ChartChartTypeEnum.chChartTypeBubbleLine, "测试统计图"); //测试不通过
 47

48
 }
}49

50

51
 private void createPicture(string fileName, Microsoft.Office.Interop.Owc11.ChartChartTypeEnum type, string title)
52


 {
{53
 this.createPicture(fileName,type, title, true);
54
 }
}55

56
 private void createPicture(string fileName,Microsoft.Office.Interop.Owc11.ChartChartTypeEnum type, string title,bool hasAxes)
57


 {
{58
 string strCategory = "1" + '\t' + "2" + '\t' + "3" + '\t' + "4" + '\t' + "5" + '\t' + "6" + '\t';
59
 string strValue = "9" + '\t' + "8" + '\t' + "4" + '\t' + "10" + '\t' + "12" + '\t' + "6" + '\t';
60

61
 //图表工作区
62
 Microsoft.Office.Interop.Owc11.ChartSpace thisChartSpace = new Microsoft.Office.Interop.Owc11.ChartSpace();
63
 //增加一个图表
64
 Microsoft.Office.Interop.Owc11.ChChart thisChChart = thisChartSpace.Charts.Add(0);
65
 //增加一个图表上的系列
66
 Microsoft.Office.Interop.Owc11.ChSeries thisChSeries = thisChChart.SeriesCollection.Add(0);
67

68
 //显示图例
69
 thisChChart.HasLegend = true;
70

71
 //设置标题
72
 thisChChart.HasTitle = true;
73
 thisChChart.Title.Caption = title;
74

75
 //图表类型
76
 thisChChart.Type = type;
77

78
 //旋转
//旋转79
 thisChChart.Rotation = 360.00;
80
 //设置倾斜度
81
 thisChChart.Inclination = 10.00;
82

83
 if (hasAxes)
84


 {
{85

86
 //给定x,y轴图示说明
87
 thisChChart.Axes[0].HasTitle = true;
88
 thisChChart.Axes[0].Title.Caption = "月份";
89

90
 thisChChart.Axes[1].HasTitle = true;
91
 thisChChart.Axes[1].Title.Caption = "数量";
92
 }
}93

94

95

 /**/////底色
96
 //thisChChart.PlotArea.Floor.Interior.Color = "green";
97

 /**/////背景颜色
98
 //thisChChart.PlotArea.Interior.Color = "red";
99

100
 //重叠
//重叠101
 //thisChChart.Overlap = 50;
102

103
 //*********************************************************************
104
 //设置指定图表对象的数据。
105
 //expression.SetData(Dimension, DataSourceIndex, DataReference)
106
 //
//107
 //Dimension ChartDimensionsEnum 常量,必需。指定设置的数据维。
108
 //ChartDimensionsEnum 可以为下列 ChartDimensionsEnum 常量之一。
 109
 // chDimBubbleValues 设置气泡图上的标志值。
 110
 // chDimCategories 设置用作分类的值。
 111
 // chDimCharts 在 HasMultipleCharts 属性设置为 True 时设置新图表的来源字段。
 112
 // chDimCloseValues 设置股票图的收盘值。
 113
 // chDimFilter 设置放置于筛选坐标轴的字段。
 114
 // chDimFormatValues 设置格式映射中的值。
 115
 // chDimHighValues 设置股票图的盘高值。
 116
 // chDimLowValues 设置股票图的盘低值。
 117
 // chDimOpenValues 设置股票图的开盘值。
 118
 // chDimRValues 设置极坐标图的 R 值。
 119
 // chDimSeriesNames 设置作为系列名称的值。
 120
 // chDimThetaValues 设置极坐标图的极角值。
 121
 // chDimValues 设置绘制图表的值。
 122
 // chDimXValues 设置 XY 散点图或气泡图的 X 值。
 123
 // chDimYValues 设置 XY 散点图或气泡图的 Y 值。
 124
 //
//125
 //DataSourceIndex Long 类型,必需。可以为 ChartSpecialDataSourcesEnum 常量。
126
 // ChartSpecialDataSourcesEnum 可以为下列 ChartSpecialDataSourcesEnum 常量之一。
 127
 // chDataBound 将指定对象绑定到 DataReference 参数指定的外部数据源。
 128
 // chDataLinked 将指定对象绑定到其他维。在 Dimension 参数中指定 chDimFormatValues 创建格式映射时使用该值。
 129
 // chDataLiteral 将指定对象绑定到 DataReference 参数指定的文字类型数据。
 130
 // chDataNone 清除指定对象。
131
 //
//132
 //DataReference Variant 类型,可选。
133
 //对于 ChChart 和 ChSeries 对象,该参数以 Microsoft Excel 样式的区域引用(例如,“A1:D4”)或行集的列名指定数据引用。
134
 //如果 DataSourceIndex 参数设置为 chDataLiteral,可以将 DataReference 设置为一维数组或逗号分隔列表。
135
 //对于 ChErrorBars 对象,该参数指定可用作误差线数值的 Double 或 String 数组。
136
 //请注意该参数仅适用于自定义误差线(误差线的 Type 属性必须设置为 chErrorBarTypeCustom)。
137

138

139
 //设置图标对象中作为系列名称的值
140
 thisChSeries.SetData(Microsoft.Office.Interop.Owc11.ChartDimensionsEnum.chDimSeriesNames, Microsoft.Office.Interop.Owc11.ChartSpecialDataSourcesEnum.chDataLiteral.GetHashCode(), "日期");
141
 //设置图标对象中用作分类的值
142
 thisChSeries.SetData(Microsoft.Office.Interop.Owc11.ChartDimensionsEnum.chDimCategories, Microsoft.Office.Interop.Owc11.ChartSpecialDataSourcesEnum.chDataLiteral.GetHashCode(), strCategory);
143
 //设置图标对象中用作数据的值
144
 thisChSeries.SetData(Microsoft.Office.Interop.Owc11.ChartDimensionsEnum.chDimValues, Microsoft.Office.Interop.Owc11.ChartSpecialDataSourcesEnum.chDataLiteral.GetHashCode(), strValue);
145

146

147

148

149

150
 //******
151
 //下面为增加图标类型代码,取消注释运行就可以
152
 //******
153

154
 //增加另外一个图表上的系列
155
 //Microsoft.Office.Interop.Owc11.ChSeries thisChSeries2 = thisChChart.SeriesCollection.Add(0);
156

157

 /**/////设置图标对象中作为系列名称的值
158
 //thisChSeries2.SetData(Microsoft.Office.Interop.Owc11.ChartDimensionsEnum.chDimSeriesNames, Microsoft.Office.Interop.Owc11.ChartSpecialDataSourcesEnum.chDataLiteral.GetHashCode(), "曲线日期");
159

 /**///////设置图标对象中用作分类的值
160
 //thisChSeries2.SetData(Microsoft.Office.Interop.Owc11.ChartDimensionsEnum.chDimCategories, Microsoft.Office.Interop.Owc11.ChartSpecialDataSourcesEnum.chDataLiteral.GetHashCode(), strCategory);
161

 /**///////设置图标对象中用作数据的值
162
 //thisChSeries2.SetData(Microsoft.Office.Interop.Owc11.ChartDimensionsEnum.chDimValues, Microsoft.Office.Interop.Owc11.ChartSpecialDataSourcesEnum.chDataLiteral.GetHashCode(), strValue);
163

164

 /**/////设置第二个图的类型
165
 //thisChSeries2.Type = Microsoft.Office.Interop.Owc11.ChartChartTypeEnum.chChartTypeLine;
166

167

 /**/////设置刻度
168
 //Microsoft.Office.Interop.Owc11.ChAxis chAxis = thisChChart.Axes.Add(thisChChart.get_Scalings(Microsoft.Office.Interop.Owc11.ChartDimensionsEnum.chDimValues));
169
 //chAxis.Position = Microsoft.Office.Interop.Owc11.ChartAxisPositionEnum.chAxisPositionRight; //刻度在右边
170

171

172
 //到处图像文件
173
 try
try174


 {
{175
 thisChartSpace.ExportPicture(Server.MapPath(fileName), "gif", 600, 300);
176
 Response.Write("<img src='" + Server.MapPath(fileName) + "'/>");
177

178
 }
}179
 catch (Exception ex)
180


 {
{181
 //抛出异常信息
182
 Response.Write(ex);
183
 }
}184
 }
}185
 }
}
186

3.测试结果图
单类型图:


多类型图:


4.参考资料
Office Developer Center http://msdn2.microsoft.com/en-us/library/aa164003(office.10).aspx
如何创建组合图表与图表 Web 组件 http://support.microsoft.com/kb/240263/
2003 .net owc11简单用法! http://blog.csdn.net/pkkfaii/archive/2006/11/14/1384276.aspx
ASP.NET中实时图表的实现 http://blog.csdn.net/yangyifan0/archive/2006/05/17/742416.aspx
microsoft office web 组件(owc11)的编程(.net) http://www.cnblogs.com/mse2002/articles/353731.html
C#编写OWC11组件源代码(2) http://7698.org/c8ccca46-8a4f-4b56-aa38-7f5e254ab6af/