matplotlib 自带绘图样式效果展示速查(全)
matplotlib 自带绘图样式效果展示速查(全)
目 录:
一、matplotlib 自带所有绘图样式效果展示
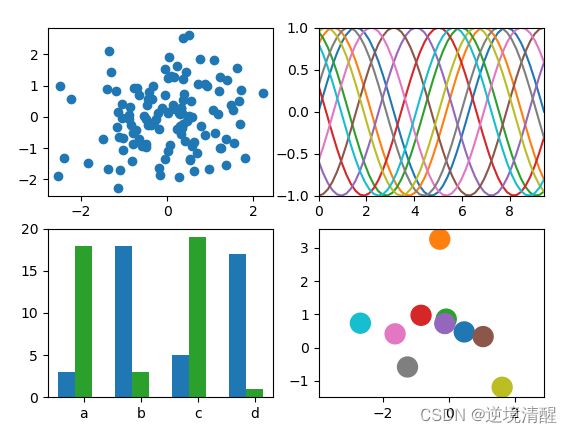
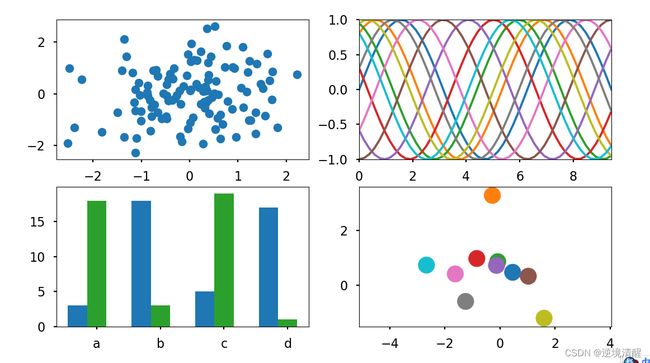
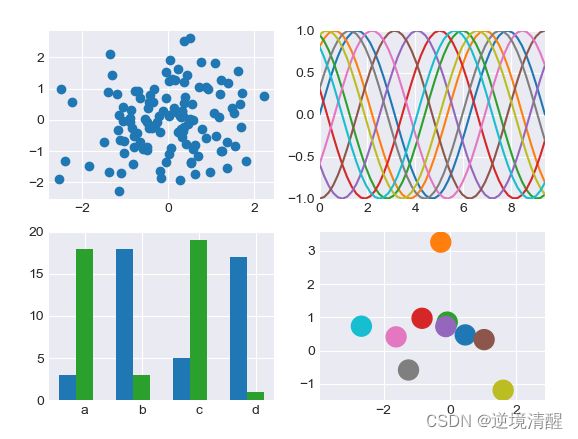
0、 【没有加style时的绘图风格】
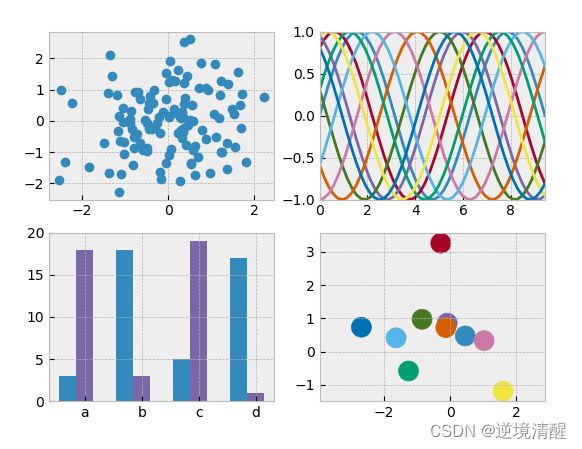
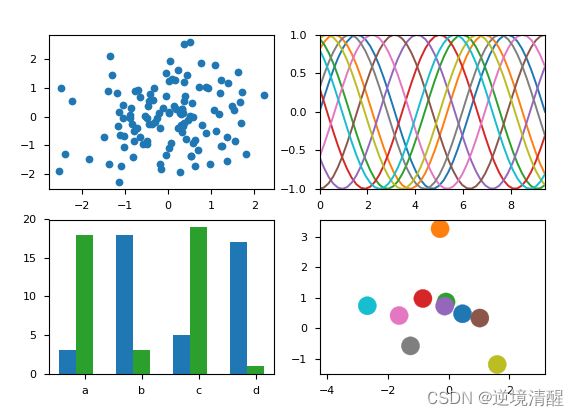
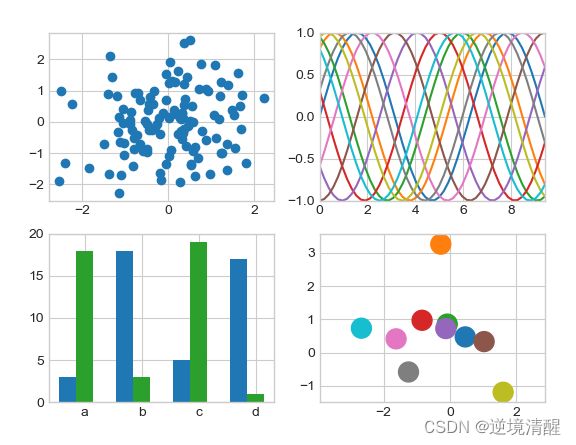
1、 【加“bmh”style时的绘图风格】
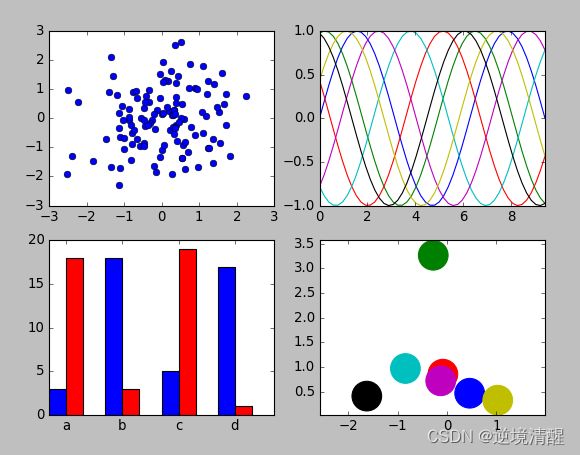
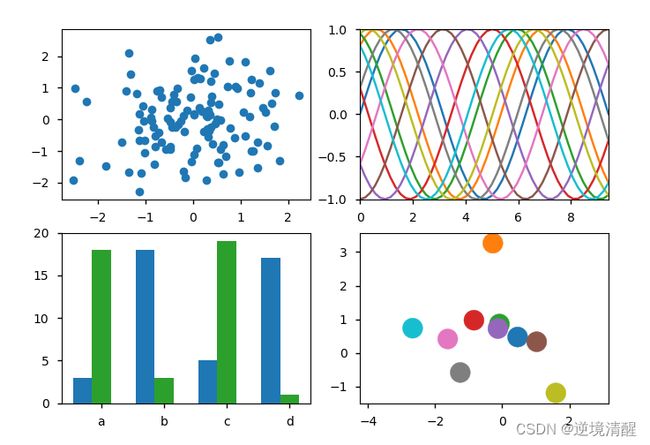
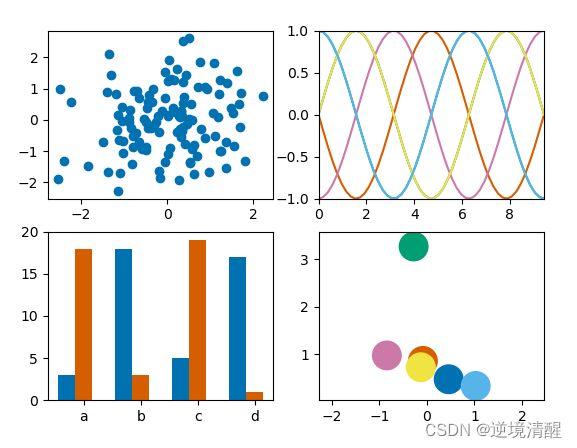
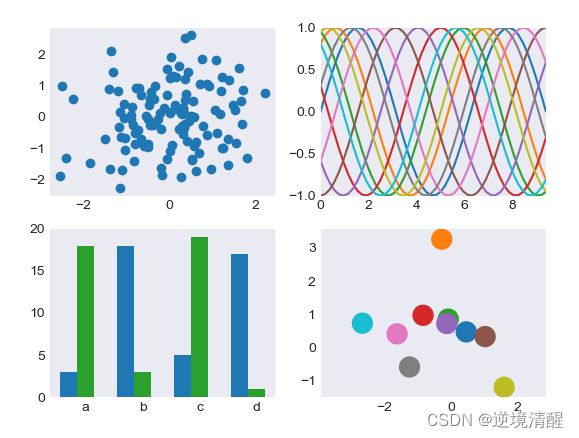
2、 【加“classic”style时的绘图风格】
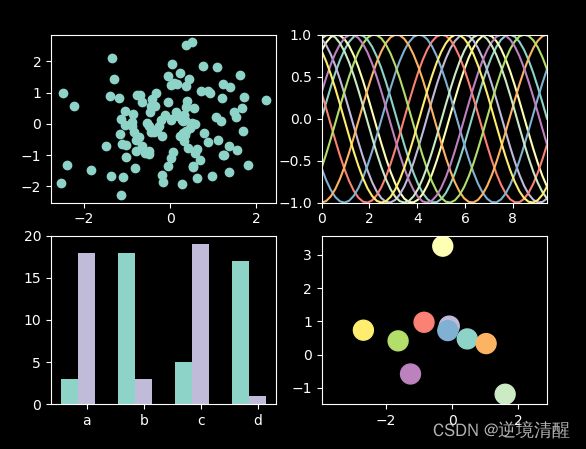
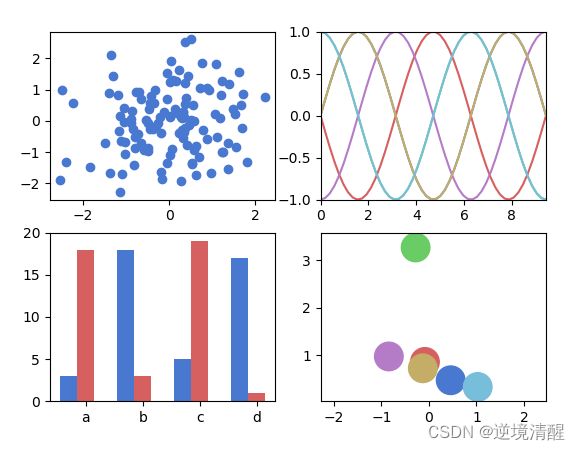
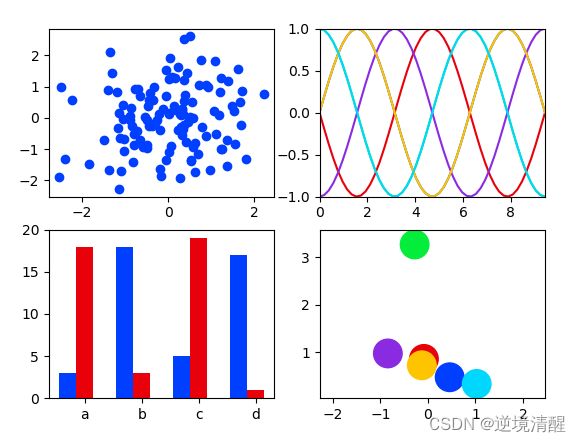
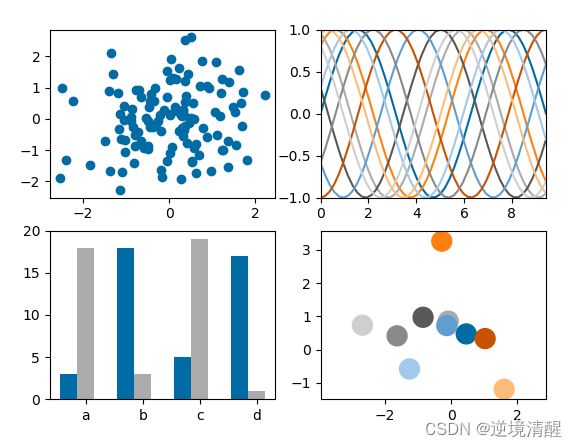
3、 【加“dark_background”style时的绘图风格】
4、 【加“fast”style时的绘图风格】
5、 【加“fivethirtyeight”style时的绘图风格】
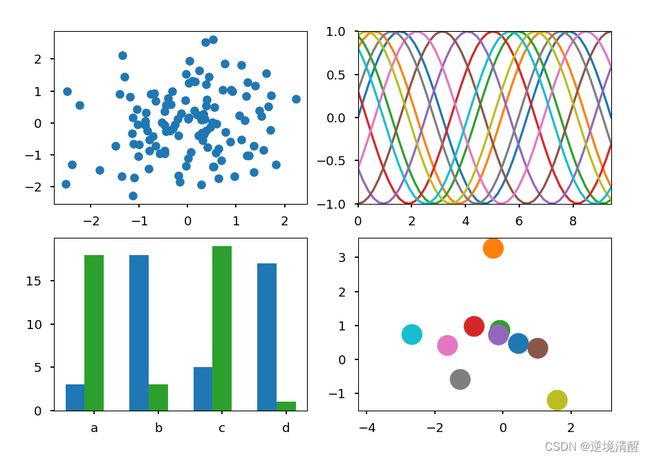
6、 【加“ggplot”style时的绘图风格】
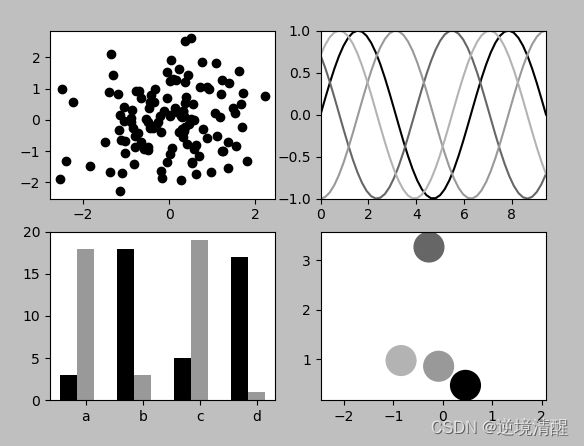
7、 【加“grayscale”style时的绘图风格】
8、 【加“Solarize_Light2”style时的绘图风格】
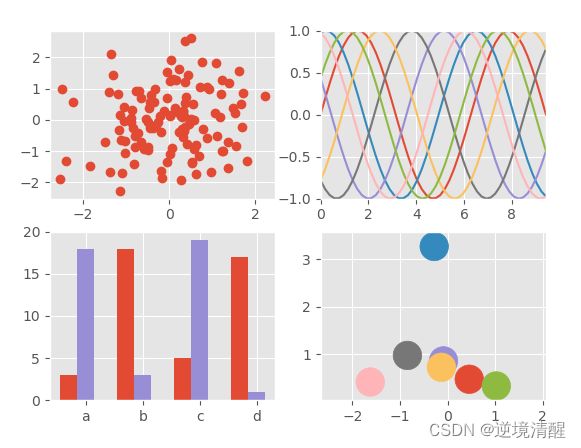
9、 【加“seaborn-pastel”style时的绘图风格】
10、【加“seaborn-poster”style时的绘图风格】
11、【加“seaborn-paper”style时的绘图风格】
12、【加“seaborn-deep”style时的绘图风格】
13、【加“seaborn-notebook”style时的绘图风格】
14、【加“seaborn-muted”style时的绘图风格】
15、【加“seaborn-dark-palette”style时的绘图风格】
16、【加“seaborn”style时的绘图风格】
17、【加“seaborn-bright”style时的绘图风格】
18、【加“seaborn-white”style时的绘图风格】
19、【加“seaborn-talk”style时的绘图风格】
20、【加“seaborn-ticks”style时的绘图风格】
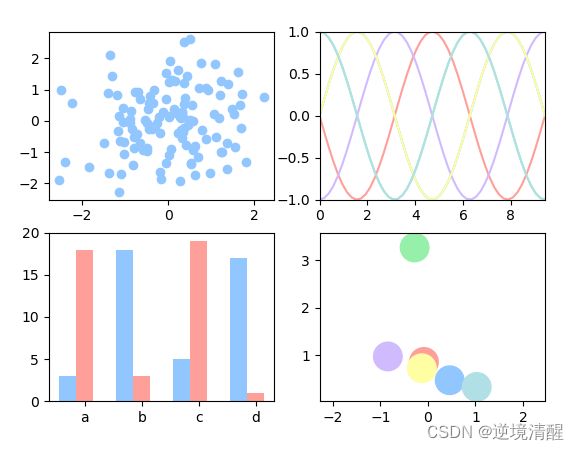
21、【加“seaborn-colorblind”style时的绘图风格】
22、【加“seaborn-darkgrid”style时的绘图风格】
23、【加“seaborn-whitegrid”style时的绘图风格】
24、【加“seaborn-dark”style时的绘图风格】
25、【加“tableau-colorblind10”style时的绘图风格】
26、【加“default”style时的绘图风格】
27、【加“_classic_test”style时的绘图风格】
二、matplotlib样式使用举例
1、没有添加任何matplotlib样式时的效果:
2、使用matplotlib 自带“classic”style时的绘图效果
3、使用matplotlib 自带“Solarize_Light2”style时的绘图效果
matplotlib样式是定义图表数据可视化外观的配置,由一组预置的rcParams参数构成。matplotlib预置了一系列样式风格,可直接使用。
使用样式:matplotlib.style.use(style名称) 可以将matplotlib的绘图样式设置为某种样式。
这里列出了matplotlib 自带所有绘图样式的效果图,方便大家查询使用。建议收藏。
一、matplotlib 自带所有绘图样式效果展示
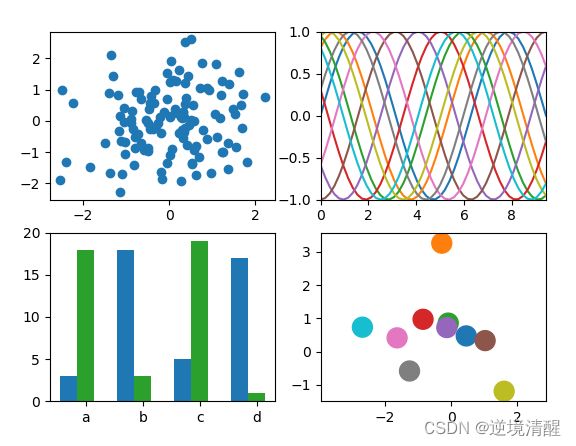
0、【没有加style时的绘图风格】
1、【加“bmh”style时的绘图风格】
2、【加“classic”style时的绘图风格】
3、【加“dark_background”style时的绘图风格】
4、【加“fast”style时的绘图风格】

5、【加“fivethirtyeight”style时的绘图风格】
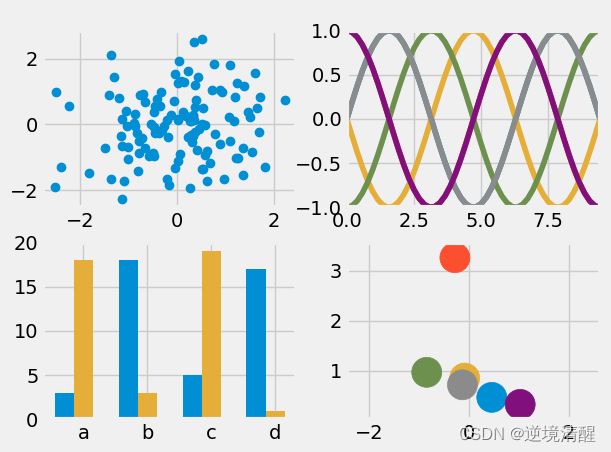
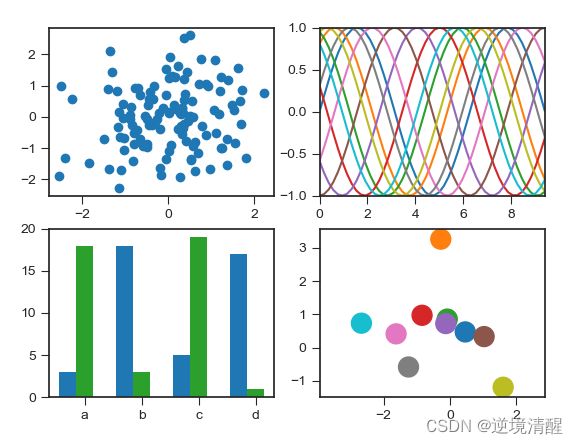
6、【加“ggplot”style时的绘图风格】
7、【加“grayscale”style时的绘图风格】
8、【加“Solarize_Light2”style时的绘图风格】

9、【加“seaborn-pastel”style时的绘图风格】
10、【加“seaborn-poster”style时的绘图风格】
11、【加“seaborn-paper”style时的绘图风格】
12、【加“seaborn-deep”style时的绘图风格】

13、【加“seaborn-notebook”style时的绘图风格】
14、【加“seaborn-muted”style时的绘图风格】
15、【加“seaborn-dark-palette”style时的绘图风格】

16、【加“seaborn”style时的绘图风格】

17、【加“seaborn-bright”style时的绘图风格】
18、【加“seaborn-white”style时的绘图风格】

19、【加“seaborn-talk”style时的绘图风格】
20、【加“seaborn-ticks”style时的绘图风格】
21、【加“seaborn-colorblind”style时的绘图风格】
22、【加“seaborn-darkgrid”style时的绘图风格】
23、【加“seaborn-whitegrid”style时的绘图风格】
24、【加“seaborn-dark”style时的绘图风格】
25、【加“tableau-colorblind10”style时的绘图风格】
26、【加“default”style时的绘图风格】
27、【加“_classic_test”style时的绘图风格】

二、matplotlib样式使用举例
1、没有添加任何matplotlib样式时的效果:
from matplotlib import pyplot as plt
import matplotlib as mpl
import numpy as np
mpl.rcParams["font.sans-serif"]=["SimHei"]
mpl.rcParams["axes.unicode_minus"]=False
xpoints=np.array([1,2,3,4,5])
ypoints=np.array([5,3,8,5,9])
plt.plot(ypoints,'oc-')
plt.title('matplotlib 自带绘图样式使用举例')
plt.xlabel('x-label')
plt.ylabel('y-label')
plt.show()

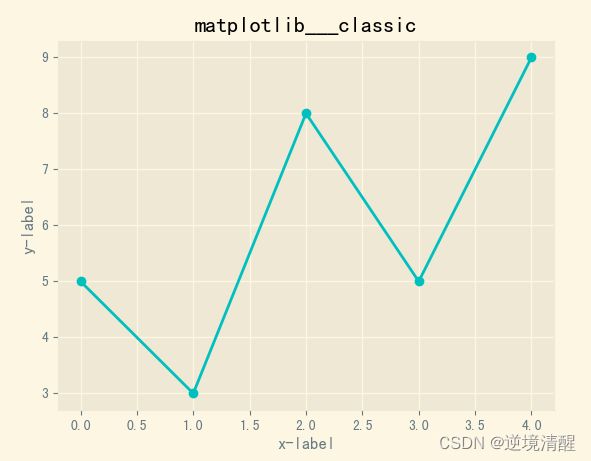
2、使用matplotlib 自带“classic”style时的绘图效果
from matplotlib import pyplot as plt
import numpy as np
plt.style.use('classic')
xpoints=np.array([1,2,3,4,5])
ypoints=np.array([5,3,8,5,9])
plt.plot(ypoints,'oc-')
plt.title('matplotlib___classic')
plt.xlabel('x-label')
plt.ylabel('y-label')
plt.show()

3、使用matplotlib 自带“Solarize_Light2”style时的绘图效果
from matplotlib import pyplot as plt
import numpy as np
plt.style.use('Solarize_Light2')
xpoints=np.array([1,2,3,4,5])
ypoints=np.array([5,3,8,5,9])
plt.plot(ypoints,'oc-')
plt.title('matplotlib___classic')
plt.xlabel('x-label')
plt.ylabel('y-label')
plt.show()
| 13 |  |
| 12 | Python List 列表(创建、索引和切片、列表反转、添加删除修改查找元素)__实例详解(全) |
| 11 | 用代码写出浪漫合集(python 绘制爱心、玫瑰花,字符画爱心、前端特效玫瑰、爱心) |
| 10 | Python函数方法实例详解全集(更新中...) |
| 9 | matplotlib 自带绘图样式效果展示速查(全) |
| 8 | 手机屏幕坏了____怎么把里面的资料导出(18种方法) |
| 7 | 2022年8月多家权威机构____编程语言排行榜__薪酬状况 |
| 6 | Python中Print()函数的用法___详解(全,例多) |
| 5 | 色彩颜色对照表系列(1~5)(16进制、RGB、CMYK、HSV、中英文名) |
| 4 | Tomcat端口配置(详细) |
| 3 | Tomcat 启动闪退问题解决集(八大类详细) |
| 2 | Apache Tomcat 各版本发行时间( v10.1.0-M17~v3.0) |
| 1 | Tomcat10安装(Windows环境)(详细) |