天池大赛之工业蒸汽量预测(有史以来最全面)
目录
- 1、导包与数据挖掘
-
-
- 1.1导包
- 1.2 数据载入
- 1.3 数据合并
- 1.4 数据分布
- 1.5 特征清洗
- 1.6 特征可视化
- 1.7 相关性系数
- 1.8 归一化
- 1.9 Box-Cox变换对连续变量分布的影响
- 1.10 目标值探索
- 1.11 定义方法获取训练和测试数据
- 1.12 定义评价指标
- 1.13 异常值过滤
-
- 2 模型训练
-
-
- 2.1 定义方法获取去除异常值的训练数据,深copy
- 2.2 定义训练模型方法
- 2.3 定义训练变量存储数据
- 2.4 使用领回归进行训练
- 2.5 弹性网络ElasticNet模型训练
- 2.6 其他模型训练
-
- 3 模型预测
-
-
- 3.1 定义模型预测方法
- 3.2 预测数据保存
- 3.3 提交天池官网
-
1、导包与数据挖掘
1.1导包
import warnings
warnings.filterwarnings("ignore")
import matplotlib.pyplot as plt
import seaborn as sns

# 模型
import pandas as pd
import numpy as np
from scipy import stats
from sklearn.model_selection import train_test_split
from sklearn.model_selection import GridSearchCV, RepeatedKFold, cross_val_score,cross_val_predict,KFold
from sklearn.metrics import make_scorer,mean_squared_error
from sklearn.linear_model import LinearRegression, Lasso, Ridge, ElasticNet
from sklearn.svm import LinearSVR, SVR
from sklearn.neighbors import KNeighborsRegressor
from sklearn.ensemble import RandomForestRegressor, GradientBoostingRegressor,AdaBoostRegressor
from xgboost import XGBRegressor
from sklearn.preprocessing import PolynomialFeatures,MinMaxScaler,StandardScaler
1.2 数据载入
#加载数据
data_train = pd.read_csv('./zhengqi_train.txt',sep = '\t')

data_test = pd.read_csv('./zhengqi_test.txt',sep = '\t')
1.3 数据合并
#合并训练数据和测试数据
data_train["oringin"]="train"
data_test["oringin"]="test"
data_all=pd.concat([data_train,data_test],axis=0,ignore_index=True)
#显示前5条数据
data_all.head()
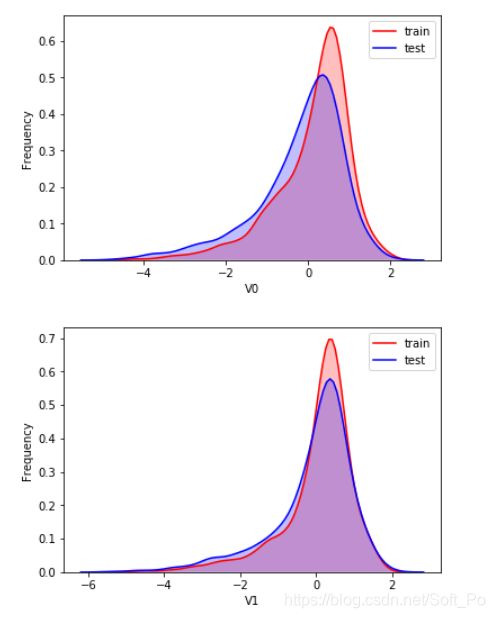
1.4 数据分布
# 探索数据分布
#fig = plt.figure(figsize=(6, 6))
for column in data_all.columns[0:-2]:
    g = sns.kdeplot(data_all[column][(data_all["oringin"] == "train")], color="Red", shade = True)
    g = sns.kdeplot(data_all[column][(data_all["oringin"] == "test")], ax =g, color="Blue", shade= True)
    g.set_xlabel(column)
    g.set_ylabel("Frequency")
    g = g.legend(["train","test"])
    plt.show()
1.5 特征清洗
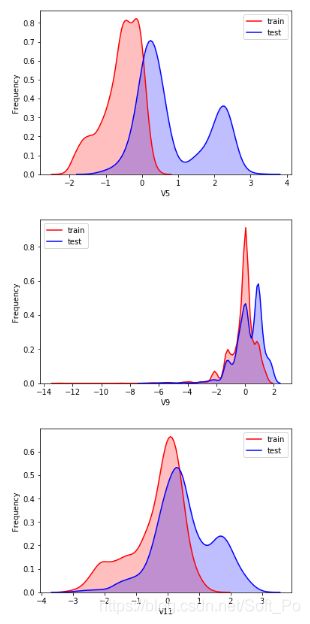
#删除特征"V5","V9","V11","V17","V22","V28",训练集和测试集分布不均
for column in ["V5","V9","V11","V17","V22","V28"]:
    g = sns.kdeplot(data_all[column][(data_all["oringin"] == "train")], color="Red", shade = True)
    g = sns.kdeplot(data_all[column][(data_all["oringin"] == "test")], ax =g, color="Blue", shade= True)
    g.set_xlabel(column)
    g.set_ylabel("Frequency")
    g = g.legend(["train","test"])
    plt.show()

data_all.drop(["V5","V9","V11","V17","V22","V28"],axis=1,inplace=True)
1.6 特征可视化
data_train1=data_all[data_all["oringin"]=="train"].drop("oringin",axis=1)

fcols = 2
frows = len(data_train.columns)
plt.figure(figsize=(5*fcols,4*frows))

i=0
for col in data_train1.columns:
    i+=1
    ax=plt.subplot(frows,fcols,i)
    sns.regplot(x=col, y='target', data=data_train, ax=ax,
                scatter_kws={'marker':'.','s':3,'alpha':0.3},
                line_kws={'color':'k'});
    plt.xlabel(col)
    plt.ylabel('target')

    i+=1
    ax=plt.subplot(frows,fcols,i)
    sns.distplot(data_train[col].dropna() , fit=stats.norm)
    plt.xlabel(col)
1.7 相关性系数
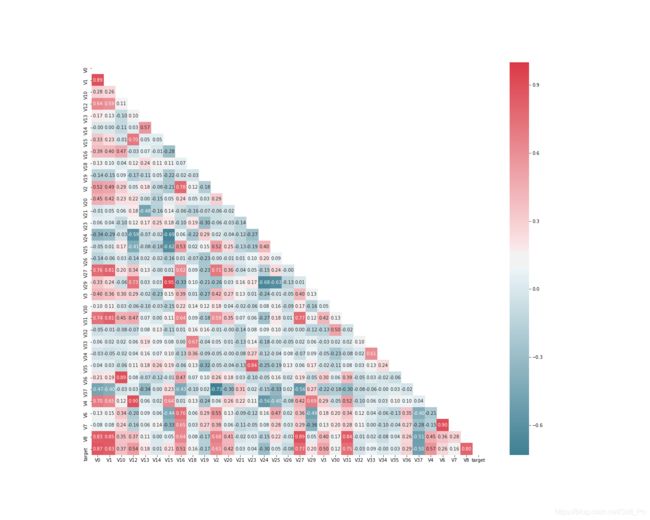
# 找出相关程度
plt.figure(figsize=(20, 16))  # 指定绘图对象宽度和高度
colnm = data_train1.columns.tolist()  # 列表头
mcorr = data_train1[colnm].corr(method="spearman")  # 相关系数矩阵,即给出了任意两个变量之间的相关系数
mask = np.zeros_like(mcorr, dtype=np.bool)  # 构造与mcorr同维数矩阵 为bool型
mask[np.triu_indices_from(mask)] = True  # 角分线右侧为True
cmap = sns.diverging_palette(220, 10, as_cmap=True)  # 返回matplotlib colormap对象
g = sns.heatmap(mcorr, mask=mask, cmap=cmap, square=True, annot=True, fmt='0.2f')  # 热力图(看两两相似度)
plt.show()
threshold = 0.1
# Absolute value correlation matrix
corr_matrix = data_train1.corr().abs()
drop_col=corr_matrix[corr_matrix["target"]
1.8 归一化
# normalise numeric columns
cols_numeric=list(data_all.columns)
cols_numeric.remove("oringin")
def scale_minmax(col):
    return (col-col.min())/(col.max()-col.min())
scale_cols = [col for col in cols_numeric if col!='target']
data_all[scale_cols] = data_all[scale_cols].apply(scale_minmax,axis=0)
data_all[scale_cols].describe()
1.9 Box-Cox变换对连续变量分布的影响
# 绘图显示Box-Cox变换对数据分布影响
fcols = 6
frows = len(cols_numeric)-1
plt.figure(figsize=(4*fcols,4*frows))
i=0

for var in cols_numeric:
    if var!='target':
        dat = data_all[[var, 'target']].dropna()

        i+=1
        plt.subplot(frows,fcols,i)
        sns.distplot(dat[var] , fit=stats.norm);
        plt.title(var+' Original')
        plt.xlabel('')

        i+=1
        plt.subplot(frows,fcols,i)
        _=stats.probplot(dat[var], plot=plt)
        plt.title('skew='+'{:.4f}'.format(stats.skew(dat[var])))
        plt.xlabel('')
        plt.ylabel('')

        i+=1
        plt.subplot(frows,fcols,i)
        plt.plot(dat[var], dat['target'],'.',alpha=0.5)
        plt.title('corr='+'{:.2f}'.format(np.corrcoef(dat[var], dat['target'])[0][1]))

        i+=1
        plt.subplot(frows,fcols,i)
        trans_var, lambda_var = stats.boxcox(dat[var].dropna()+1)
        trans_var = scale_minmax(trans_var)
        sns.distplot(trans_var , fit=stats.norm);
        plt.title(var+' Tramsformed')
        plt.xlabel('')

        i+=1
        plt.subplot(frows,fcols,i)
        _=stats.probplot(trans_var, plot=plt)
        plt.title('skew='+'{:.4f}'.format(stats.skew(trans_var)))
        plt.xlabel('')
        plt.ylabel('')

        i+=1
        plt.subplot(frows,fcols,i)
        plt.plot(trans_var, dat['target'],'.',alpha=0.5)
        plt.title('corr='+'{:.2f}'.format(np.corrcoef(trans_var,dat['target'])[0][1]))

从回归结果可见,经过Box-Cox变换数据分布,更加正态化,所以进行Box-Cox变换很有必要
Box-Cox变换是Box和Cox在1964年提出的一种广义幂变换方法,是统计建模中常用的一种数据变换,用于连续的响应变量不满足正态分布的情况
Box-Cox变换的一般形式为:
y ( λ ) = { l n y , y = 0 y λ − 1 λ , λ ≠ 0 y(\lambda) = \{^{\frac{y^\lambda -1}{\lambda},\lambda \neq 0}_{lny,y =0} y(λ)={lny,y=0λyλ−1,λ=0
# 进行Box-Cox变换
cols_transform=data_all.columns[0:-2]
for col in cols_transform:
    # transform column
    data_all.loc[:,col], _ = stats.boxcox(data_all.loc[:,col]+1)
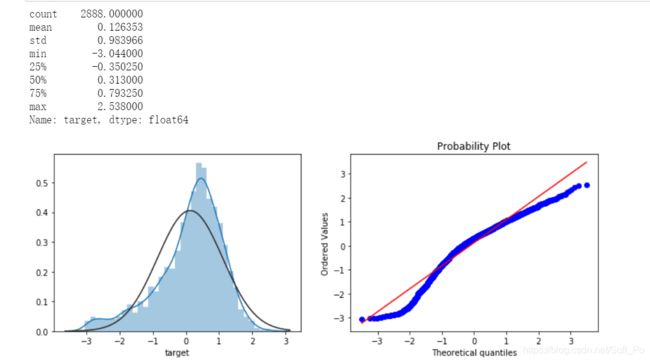
1.10 目标值探索
print(data_all.target.describe())
plt.figure(figsize=(12,4))
plt.subplot(1,2,1)
sns.distplot(data_all.target.dropna() , fit=stats.norm);
plt.subplot(1,2,2)
_=stats.probplot(data_all.target.dropna(), plot=plt)
#对数变换target目标值提升正太性
sp = data_train.target
data_train.target1 =np.power(1.5,sp)
print(data_train.target1.describe())

plt.figure(figsize=(12,4))
plt.subplot(1,2,1)
sns.distplot(data_train.target1.dropna(),fit=stats.norm);
plt.subplot(1,2,2)
_=stats.probplot(data_train.target1.dropna(), plot=plt)
1.11 定义方法获取训练和测试数据
# function to get training samples
def get_training_data():
    # extract training samples
    from sklearn.model_selection import train_test_split
    df_train = data_all[data_all["oringin"]=="train"]
    df_train["label"]=data_train.target1
    # split SalePrice and features
    y = df_train.target
    X = df_train.drop(["oringin","target","label"],axis=1)
    X_train,X_valid,y_train,y_valid=train_test_split(X,y,test_size=0.3,random_state=100)
    return X_train,X_valid,y_train,y_valid

# extract test data (without SalePrice)
def get_test_data():
    df_test = data_all[data_all["oringin"]=="test"].reset_index(drop=True)
    return df_test.drop(["oringin","target"],axis=1)
1.12 定义评价指标
from sklearn.metrics import make_scorer
# metric for evaluation
def rmse(y_true, y_pred):
    diff = y_pred - y_true
    sum_sq = sum(diff**2)
    n = len(y_pred)

    return np.sqrt(sum_sq/n)
def mse(y_ture,y_pred):
    return mean_squared_error(y_ture,y_pred)

# scorer to be used in sklearn model fitting
rmse_scorer = make_scorer(rmse, greater_is_better=False)
mse_scorer = make_scorer(mse, greater_is_better=False)
1.13 异常值过滤
# function to detect outliers based on the predictions of a model
def find_outliers(model, X, y, sigma=3):

    # predict y values using model
    model.fit(X,y)
    y_pred = pd.Series(model.predict(X), index=y.index)

    # calculate residuals between the model prediction and true y values
    resid = y - y_pred
    mean_resid = resid.mean()
    std_resid = resid.std()

    # calculate z statistic, define outliers to be where |z|>sigma
    z = (resid - mean_resid)/std_resid
    outliers = z[abs(z)>sigma].index

    # print and plot the results
    print('R2=',model.score(X,y))
    print('rmse=',rmse(y, y_pred))
    print("mse=",mean_squared_error(y,y_pred))
    print('---------------------------------------')

    print('mean of residuals:',mean_resid)
    print('std of residuals:',std_resid)
    print('---------------------------------------')

    print(len(outliers),'outliers:')
    print(outliers.tolist())

    plt.figure(figsize=(15,5))
    ax_131 = plt.subplot(1,3,1)
    plt.plot(y,y_pred,'.')
    plt.plot(y.loc[outliers],y_pred.loc[outliers],'ro')
    plt.legend(['Accepted','Outlier'])
    plt.xlabel('y')
    plt.ylabel('y_pred');

    ax_132=plt.subplot(1,3,2)
    plt.plot(y,y-y_pred,'.')
    plt.plot(y.loc[outliers],y.loc[outliers]-y_pred.loc[outliers],'ro')
    plt.legend(['Accepted','Outlier'])
    plt.xlabel('y')
    plt.ylabel('y - y_pred');

    ax_133=plt.subplot(1,3,3)
    z.plot.hist(bins=50,ax=ax_133)
    z.loc[outliers].plot.hist(color='r',bins=50,ax=ax_133)
    plt.legend(['Accepted','Outlier'])
    plt.xlabel('z')

    plt.savefig('outliers.png')

    return outliers
使用领回归算法过滤异常值
# get training data
from sklearn.linear_model import Ridge
X_train, X_valid,y_train,y_valid = get_training_data()
test=get_test_data()

# find and remove outliers using a Ridge model
outliers = find_outliers(Ridge(), X_train, y_train)
X_outliers=X_train.loc[outliers]
y_outliers=y_train.loc[outliers]
X_t=X_train.drop(outliers)
y_t=y_train.drop(outliers)
2 模型训练
2.1 定义方法获取去除异常值的训练数据,深copy
def get_trainning_data_omitoutliers():
    y=y_t.copy()
    X=X_t.copy()
    return X,y
2.2 定义训练模型方法
from sklearn.preprocessing import StandardScaler
def train_model(model, param_grid=[], X=[], y=[],
                splits=5, repeats=5):

    # 获取数据
    if len(y)==0:
        X,y = get_trainning_data_omitoutliers()

    # 交叉验证
    rkfold = RepeatedKFold(n_splits=splits, n_repeats=repeats)

    # 网格搜索最佳参数
    if len(param_grid)>0:
        gsearch = GridSearchCV(model, param_grid, cv=rkfold,
                               scoring="neg_mean_squared_error",
                               verbose=1, return_train_score=True)

        # 训练
        gsearch.fit(X,y)

        # 最好的模型
        model = gsearch.best_estimator_
        best_idx = gsearch.best_index_

        # 获取交叉验证评价指标
        grid_results = pd.DataFrame(gsearch.cv_results_)
        cv_mean = abs(grid_results.loc[best_idx,'mean_test_score'])
        cv_std = grid_results.loc[best_idx,'std_test_score']

    # 没有网格搜索
    else:
        grid_results = []
        cv_results = cross_val_score(model, X, y, scoring="neg_mean_squared_error", cv=rkfold)
        cv_mean = abs(np.mean(cv_results))
        cv_std = np.std(cv_results)

    # 合并数据
    cv_score = pd.Series({'mean':cv_mean,'std':cv_std})

    # 预测
    y_pred = model.predict(X)

    # 模型性能的统计数据
    print('----------------------')
    print(model)
    print('----------------------')
    print('score=',model.score(X,y))
    print('rmse=',rmse(y, y_pred))
    print('mse=',mse(y, y_pred))
    print('cross_val: mean=',cv_mean,', std=',cv_std)

    # 残差分析与可视化
    y_pred = pd.Series(y_pred,index=y.index)
    resid = y - y_pred
    mean_resid = resid.mean()
    std_resid = resid.std()
    z = (resid - mean_resid)/std_resid
    n_outliers = sum(abs(z)>3)
    outliers = z[abs(z)>3].index

    plt.figure(figsize=(15,5))
    ax_131 = plt.subplot(1,3,1)
    plt.plot(y,y_pred,'.')
    plt.plot(y.loc[outliers],y_pred.loc[outliers],'ro')
    plt.xlabel('y')
    plt.ylabel('y_pred');
    plt.title('corr = {:.3f}'.format(np.corrcoef(y,y_pred)[0][1]))
    ax_132=plt.subplot(1,3,2)
    plt.plot(y,y-y_pred,'.')
    plt.plot(y.loc[outliers],y_pred.loc[outliers],'ro')
    plt.xlabel('y')
    plt.ylabel('y - y_pred');
    plt.title('std resid = {:.3f}'.format(std_resid))

    ax_133=plt.subplot(1,3,3)
    z.plot.hist(bins=50,ax=ax_133)
    z.loc[outliers].plot.hist(color='r',bins=50,ax=ax_133)
    plt.xlabel('z')
    plt.title('{:.0f} samples with z>3'.format(n_outliers))

    return model, cv_score, grid_results
2.3 定义训练变量存储数据
# 定义训练变量存储数据
opt_models = dict()
score_models = pd.DataFrame(columns=['mean','std'])
# no. k-fold splits
splits=5
# no. k-fold iterations
repeats=5
2.4 使用领回归进行训练
model = 'Ridge'
opt_models[model] = Ridge()
alph_range = np.arange(0.25,6,0.25)
param_grid = {'alpha': alph_range}

opt_models[model],cv_score,grid_results = train_model(opt_models[model], param_grid=param_grid,
                                              splits=splits, repeats=repeats)

cv_score.name = model
score_models = score_models.append(cv_score)

plt.figure()
plt.errorbar(alph_range, abs(grid_results['mean_test_score']),
             abs(grid_results['std_test_score'])/np.sqrt(splits*repeats))
plt.xlabel('alpha')
plt.ylabel('score')
2.5 弹性网络ElasticNet模型训练
网格搜索中多个参数,无法单一变量绘制误差棒图(errorbar)
model ='ElasticNet'
opt_models[model] = ElasticNet()
alpha_range = np.arange(1e-4,1e-3,1e-4)
param_grid = {'alpha': alpha_range,
              'l1_ratio': np.arange(0.1,1.0,0.1)}

opt_models[model], cv_score, grid_results = train_model(opt_models[model], param_grid=param_grid,
                                              splits=splits, repeats=1)

cv_score.name = model
score_models = score_models.append(cv_score)
2.6 其他模型训练
Lasso、LinearSVR、K近邻、随机森林、梯度提升树、XGB、Adaboost、LightGBM等
3 模型预测
3.1 定义模型预测方法
先忽略stack参数,后面会用到
# 预测
def model_predict(test_data,test_y=[],stack=False):
    i=0
    y_predict_total=np.zeros((test_data.shape[0],))
    if stack:
        for model in metal_models.keys():
            y_predict=metal_models[model].predict(test_data)
            y_predict_total+=y_predict
            i+=1
            if len(test_y)>0:
                print("{}_mse:".format(model),mean_squared_error(y_predict,test_y))
        y_predict_mean=np.round(y_predict_total/i,6)
        if len(test_y)>0:
            print("mean_mse:",mean_squared_error(y_predict_mean,test_y))
        else:
            y_metal_mean=pd.Series(y_predict_mean)
            return y_metal_mean
    else:
        for model in opt_models.keys():
            if model!="LinearSVR" and model!="KNeighbors":
                y_predict=opt_models[model].predict(test_data)
                y_predict_total+=y_predict
                i+=1
            if len(test_y)>0:
                print("{}_mse:".format(model),mean_squared_error(y_predict,test_y))
        y_predict_mean=np.round(y_predict_total/i,6)
        if len(test_y)>0:
            print("mean_mse:",mean_squared_error(y_predict_mean,test_y))
        else:
            y_predict_mean=pd.Series(y_predict_mean)
            return y_predict_mean
3.2 预测数据保存
y_ = model_predict(test)
y_.to_csv('./predict_.txt',header = None,index = False)

